Quantcast
Channel: Search Results for “pca”– R-bloggers
Viewing all 209 articles
Browse latest View live

Reinventing the wheel for ordination biplots with ggplot2

$
0
0

(This article was first published on R is my friend » R, and kindly contributed to R-bloggers)

I’ll be the first to admit that the topic of plotting ordination results using ggplot2 has been visited many times over. As is my typical fashion, I started creating a package for this purpose without completely searching for existing solutions. Specifically, the ggbiplot and factoextra packages already provide almost complete coverage of plotting results from multivariate and ordination analyses in R. Being the stubborn individual, I couldn’t give up on my own package so I started exploring ways to improve some of the functionality of biplot methods in these existing packages. For example, ggbiplot and factoextra work almost exclusively with results from principal components analysis, whereas numerous other multivariate analyses can be visualized using the biplot approach. I started to write methods to create biplots for some of the more common ordination techniques, in addition to all of the functions I could find in R that conduct PCA. This exercise became very boring very quickly so I stopped adding methods after the first eight or so. That being said, I present this blog as a sinking ship that was doomed from the beginning, but I’m also hopeful that these functions can be built on by others more ambitious than myself.

The process of adding methods to a default biplot function in ggplot was pretty simple and not the least bit interesting. The default ggpord biplot function (see here) is very similar to the default biplot function from the stats base package. Only two inputs are used, the first being a two column matrix of the observation scores for each axis in the biplot and the second being a two column matrix of the variable scores for each axis. Adding S3 methods to the generic function required extracting the relevant elements from each model object and then passing them to the default function. Easy as pie but boring as hell.

I’ll repeat myself again. This package adds nothing new to the functionality already provided by ggbiplot and factoextra. However, I like to think that I contributed at least a little bit by adding more methods to the biplot function. On top of that, I’m also naively hopeful that others will be inspired to fork my package and add methods. Here you can view the raw code for the ggord default function and all methods added to that function. Adding more methods is straightforward, but I personally don’t have any interest in doing this myself. So who wants to help??

Visit the package repo here or install the package as follows.

library(devtools)
install_github('fawda123/ggord')
library(ggord)

Available methods and examples for each are shown below. These plots can also be reproduced from the examples in the ggord help file.

##  [1] ggord.acm      ggord.ca       ggord.coa      ggord.default 
##  [5] ggord.lda      ggord.mca      ggord.MCA      ggord.metaMDS 
##  [9] ggord.pca      ggord.PCA      ggord.prcomp   ggord.princomp
# principal components analysis with the iris data set
# prcomp
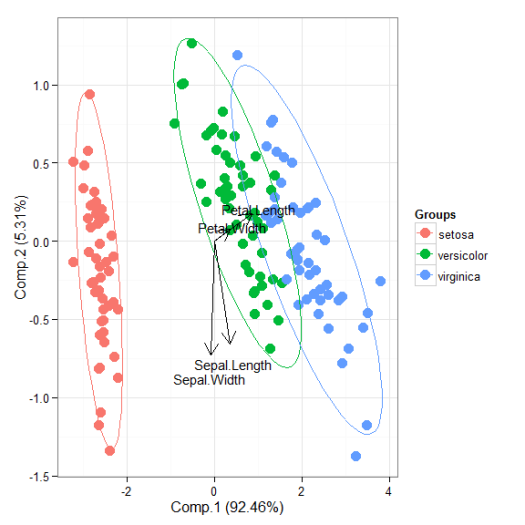
ord <- prcomp(iris[, 1:4])

p <- ggord(ord, iris$Species)
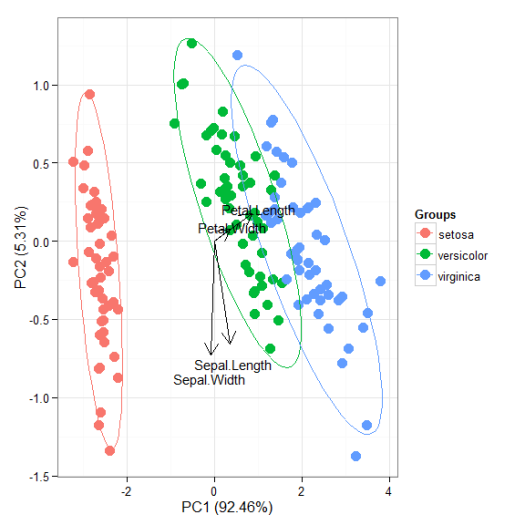
p

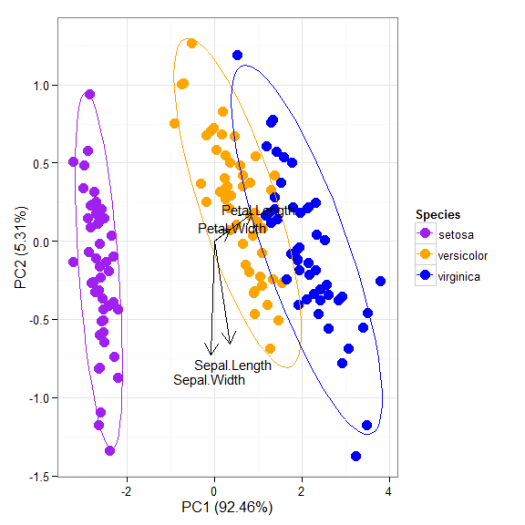
p + scale_colour_manual('Species', values = c('purple', 'orange', 'blue'))

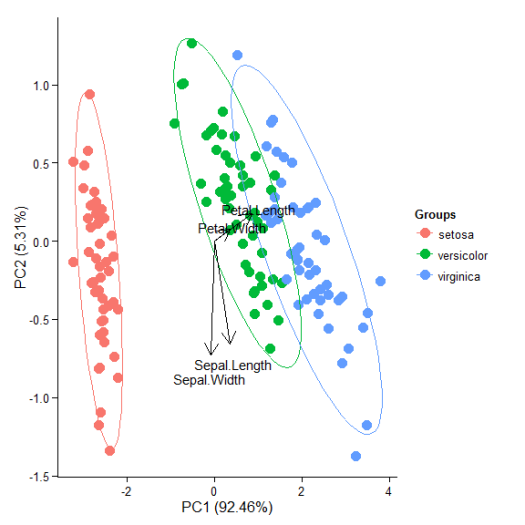
p + theme_classic()

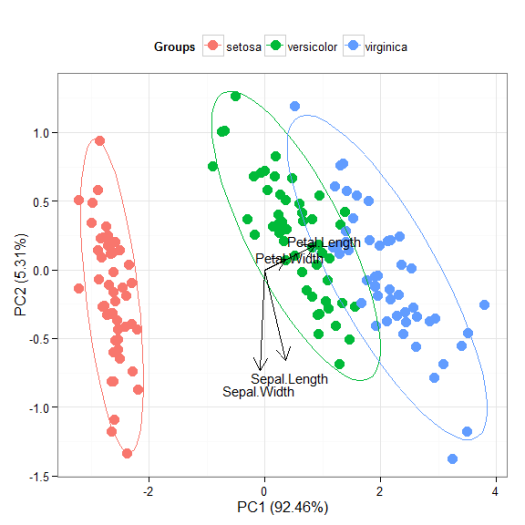
p + theme(legend.position = 'top')

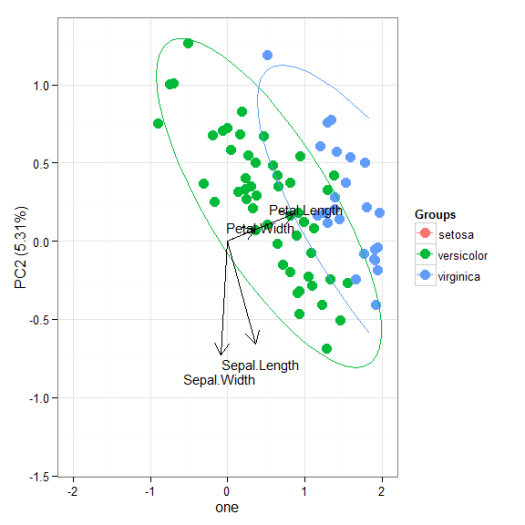
p + scale_x_continuous(limits = c(-2, 2))

# principal components analysis with the iris dataset
# princomp
ord <- princomp(iris[, 1:4])

ggord(ord, iris$Species)

# principal components analysis with the iris dataset
# PCA
library(FactoMineR)

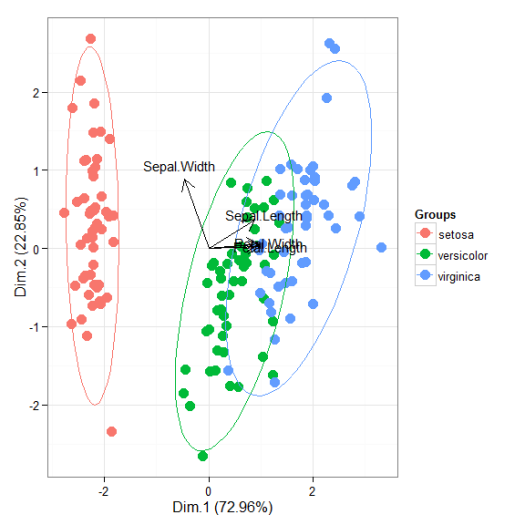
ord <- PCA(iris[, 1:4], graph = FALSE)

ggord(ord, iris$Species)

# principal components analysis with the iris dataset
# dudi.pca
library(ade4)

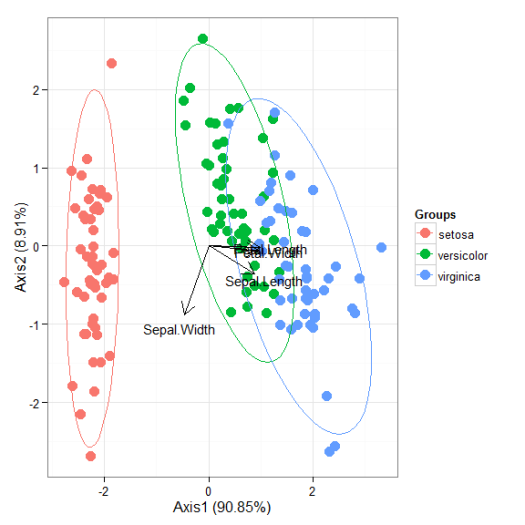
ord <- dudi.pca(iris[, 1:4], scannf = FALSE, nf = 4)

ggord(ord, iris$Species)

# multiple correspondence analysis with the tea dataset
# MCA
data(tea)
tea <- tea[, c('Tea', 'sugar', 'price', 'age_Q', 'sex')]

ord <- MCA(tea[, -1], graph = FALSE)

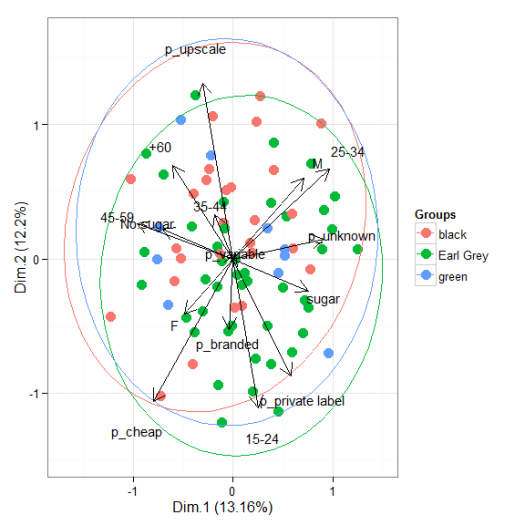
ggord(ord, tea$Tea)

# multiple correspondence analysis with the tea dataset
# mca
library(MASS)

ord <- mca(tea[, -1])

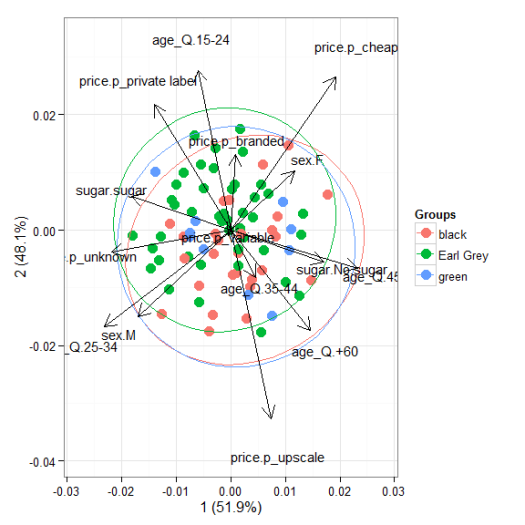
ggord(ord, tea$Tea)

# multiple correspondence analysis with the tea dataset
# acm
ord <- dudi.acm(tea[, -1], scannf = FALSE)

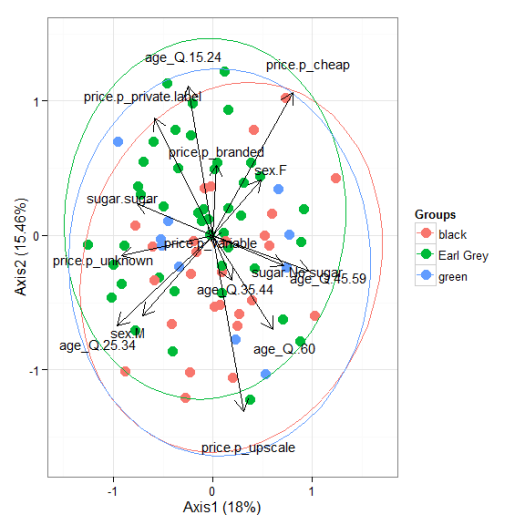
ggord(ord, tea$Tea)

# nonmetric multidimensional scaling with the iris dataset
# metaMDS
library(vegan)
ord <- metaMDS(iris[, 1:4])

ggord(ord, iris$Species)

# linear discriminant analysis
# example from lda in MASS package
ord <- lda(Species ~ ., iris, prior = rep(1, 3)/3)

ggord(ord, iris$Species)

# correspondence analysis
# dudi.coa
ord <- dudi.coa(iris[, 1:4], scannf = FALSE, nf = 4)

ggord(ord, iris$Species)

# correspondence analysis
# ca
library(ca)
ord <- ca(iris[, 1:4])

ggord(ord, iris$Species)

Cheers,

Marcus


To leave a comment for the author, please follow the link and comment on his blog: R is my friend » R.

R-bloggers.com offers daily e-mail updates about R news and tutorials on topics such as: visualization (ggplot2, Boxplots, maps, animation), programming (RStudio, Sweave, LaTeX, SQL, Eclipse, git, hadoop, Web Scraping) statistics (regression, PCA, time series, trading) and more...
Interactive maps for the web in R

$
0
0

(This article was first published on R Video tutorial for Spatial Statistics, and kindly contributed to R-bloggers)
Static Maps
In the last post I showed how to download economic data from the World Bank's website and create choropleth maps in R (Global Economic Maps).
In this post I want to focus more on how to visualize those maps.

Sp Package
Probably the simplest way of plotting choropleth maps in R is the one I showed in the previous post, using the function ssplot(). For example with a call like the following:

library(sp)
spplot(polygons,"CO2",main=paste("CO2 Emissions - Year:",CO2.year),sub="Metric Tons per capita")

This function takes the object polygons, which is a SpatialPolygonsDataFrame, and in quotations marks the name of the column where to find the values to assign, as colors, to each polygon. This are two basic mandatory elements to call the function. However, we can increase the information in the plot by adding additional elements, such as a title, option main, and a sub title, option sub.

This function creates the following plot:

The color scale is selected automatically and can be changed with a couple of standard functions or using customized color scales. For more information please refer to this page: http://rstudio-pubs-static.s3.amazonaws.com/7202_3145df2a90a44e6e86a0637bc4264f9f.html


Standard Plot
Another way of plotting maps is by using the standard plot() function, which allows us to increase the flexibility of the plot, for example by customizing the position of the color legend.
The flip side is that, since it is the most basic plotting function available and it does not have many built-in options, this function require more lines of code to achieve a good result.
Let's take a look at the code below:

library(plotrix)
CO2.dat <- na.omit(polygons$CO2)
colorScale <- color.scale(CO2.dat,color.spec="rgb",extremes=c("red","blue"),alpha=0.8)
 
colors.DF <- data.frame(CO2.dat,colorScale)
colors.DF <- colors.DF[with(colors.DF, order(colors.DF[,1])), ]
colors.DF$ID <- 1:nrow(colors.DF)
breaks <- seq(1,nrow(colors.DF),length.out=10)
 
 
jpeg("CO2_Emissions.jpg",7000,5000,res=300)
plot(polygons,col=colorScale)
title("CO2 Emissions",cex.main=3)
 
legend.pos <- list(x=-28.52392,y=-20.59119)
legendg(legend.pos,legend=c(round(colors.DF[colors.DF$ID %in% round(breaks,0),1],2)),fill=paste(colors.DF[colors.DF$ID %in% round(breaks,0),2]),bty="n",bg=c("white"),y.intersp=0.75,title="Metric tons per capita",cex=0.8)
 
dev.off()


By simpling calling the plot function with the object polygons, R is going to create an image of the country borders with no filling. If we want to add colors to the plot we first need to create a color scale using our data. To do so we can use the function color.scale() in the package plotrix, which I used also in the post regarding the visualization seismic events from USGS (Downloading and Visualizing Seismic Events from USGS ). This function takes a vector, plus the color of the extremes of the color scale, in this case red and blue, and creates a vector of intermediate colors to assign to each element of the data vector.
In this example I first created a vector named CO2.dat, with the values of CO2 for each polygon, excluding NAs. Then I feed it to the color.scale() function.

The next step is the creation of the legend. The first step is the creation of the breaks we are going to need to present the full spectrum of colors used in the plot. For this I first created a data.frame with values and colors and then I subset it into 10 elements, which is the length of the legend.
Now we can submit the rest of the code to create a plot and the legend and save it into the jpeg file below:


Interactive Maps
The maps we created thus far are good for showing our data on papers and allow the reader to have a good understanding of what we are trying to show with them. Clearly these are not the only two methods available to create maps in R, many more are available. In particular ggplot2 now features ways of creating beautiful static maps. For more information please refer to these website and blog posts:
Maps in R
Making Maps in R
Introduction to Spatial Data and ggplot2
Plot maps like a boss
Making Maps with R

In this post however, I would like to focus on ways to move away from static maps and embrace the fact that we are now connected to the web all the times. This allow us to create maps specifically design for the web, which can also be much more easy to read by the general public that is used to them.
These sort of maps are the interactive maps that we see all over the web, for example from Google. These are created in javascript and are extremely powerful. The problem is, we know R and we work on it all the time, but we do not necessarily know how to code in javascript. So how can we create beautiful interactive maps for the web if we cannot code in javascript and HTML?

Luckily for us developers have create packages that allow us to create maps using standard R code but n the form of HTML page that we can upload directly on our website. I will now examine the packages I know and use regularly for plotting choropleth maps.


googleVis
This package is extremely simple to use and yet capable of creating beautiful maps that can be uploaded easily to our website.
Let's look at the code below:

data.poly <- as.data.frame(polygons)
data.poly <- data.poly[,c(5,12)]
names(data.poly) <- c("Country Name","CO2 emissions (metric tons per capita)")
 
map <- gvisGeoMap(data=data.poly, locationvar = "Country Name", numvar='CO2 emissions (metric tons per capita)',options=list(width='800px',heigth='500px',colors="['0x0000ff', '0xff0000']"))
plot(map)
 
print(map,file="Map.html")
 
#http://www.javascripter.net/faq/rgbtohex.htm
#To find HEX codes for RGB colors

The first thing to do is clearly to load the package googleVis. Then we have to transform the SpatialPolygonsDataFrame into a standard data.frame. Since we are interested in plotting only the data related to the CO2 emissions for each country (as far as I know with this package we can plot only one variable for each map), we can subset the data.frame, keeping only the column with the names of each country and the one with the CO2 emissions. Then we need to change the names of these two columns so that the user can readily understand what he is looking at.
Then we can simply use the function gvisGeoMap() to create a choropleth maps using the Google Visualisation API. This function does not read the coordinates from the object, but we need to provide the names of the geo locations to use with the option locationvar, in this case the Google Visualisation API will take the names of the polygons and match them to the geometry of the country. Then we have the option numvar, which takes the name of the column where to find the data for each country. Then we have options, where we can define various customizations available in the Google Visualisation API and provided at this link: GoogleVis API Options
In this case I specified the width and height of the map, plus the two color extremes to use for the color scale. 
The result is the plot below:


This is an interactive plot, meaning that if I hover the mouse over a country the map will tell me the name and the amount of CO2 emitted. This map is generated directly from R but it all written in HTML and javascript. We can use the function print(), presented in the snippet above, to save the map into an HTML file that can upload as is on the web.
The map above is accessible from this link:  GoogleVis Map


plotGoogleMaps
This is another great package that harness the power of Google's APIs to create intuitive and fully interactive web maps. The difference between this and the previous package is that here we are going to create interactive maps using the Google Maps API, which is basically the one you use when you look up a place on Google Maps.
Again this API uses javascript to create maps and overlays, such as markers and polygons. However, with this package we can use very simple R code and create stunning HTML pages that we can just upload to our websites and share with friends and colleagues.

Let's look at the following code:

library(plotGoogleMaps)
 
polygons.plot <- polygons[,c("CO2","GDP.capita","NAME")]
polygons.plot <- polygons.plot[polygons.plot$NAME!="Antarctica",]
names(polygons.plot) <- c("CO2 emissions (metric tons per capita)","GDP per capita (current US$)","Country Name")
 
#Full Page Map
map <- plotGoogleMaps(polygons.plot,zoom=4,fitBounds=F,filename="Map_GoogleMaps.html",layerName="Economic Data")
 
 
#To add this to an existing HTML page
map <- plotGoogleMaps(polygons.plot,zoom=2,fitBounds=F,filename="Map_GoogleMaps_small.html",layerName="Economic Data",map="GoogleMap",mapCanvas="Map",map.width="800px",map.height="600px",control.width="200px",control.height="600px")

Again there is a bit of data preparation to make. Again we need to subset the polygons dataset and keep only the variable we would need for the plot (with this package this is not mandatory, but it is maybe good to avoid large objects). Then we have to exclude Antarctica, otherwise the interactive map will have some problems (you can try and leave it to see what it does and maybe figure out a way to solve it). Then again we change the names of the columns in order to be more informative.

At this point we can use the function plotGoogleMaps() to create web maps in javascript. This function is extremely simple to use, it just takes one argument, which is the data.frame and creates a web map (R opens the browser to show the output). There are clearly ways to customize the output, for example by choosing a level of zoom (in this case the fiBounds option needs to be set to FALSE). We can also set a layerName to show in the legend, which is automatically created by the function.
Finally, because we want to create an HTML file to upload to our website, we can use the option filename to save it.
The result is a full screen map like the one below:


This map is available here: GoogleMaps FullScreen


With this function we also have ways to customize not only the map itself but also the HTML page so that we can later add information to it. In the last line of the code snippet above you can see that I added the following options to the function plotGoogleMaps():

mapCanvas="Map",map.width="800px",map.height="600px",control.width="200px",control.height="600px"


These options are intended to modify the aspect of the map on the web page, for example its width and height, and the aspect of the legend and controls, with controls.width and controls.height. We can also add the id of the HTML <div> element that will contain the final map.
If we have some basic experience with HTML we can then open the file and tweak a bit, for example by shifting map and legend to the center and adding a title and some more info.


This map is available here: GoogleMaps Small

The full code to replicate this experiment is presented below:

 #Methods to Plot Choropleth Maps in R  
load(url("http://www.fabioveronesi.net/Blog/polygons.RData"))

#Standard method
#SP PACKAGE
library(sp)
spplot(polygons,"CO2",main=paste("CO2 Emissions - Year:",CO2.year),sub="Metric Tons per capita")


#PLOT METHOD
library(plotrix)
CO2.dat <- na.omit(polygons$CO2)
colorScale <- color.scale(CO2.dat,color.spec="rgb",extremes=c("red","blue"),alpha=0.8)

colors.DF <- data.frame(CO2.dat,colorScale)
colors.DF <- colors.DF[with(colors.DF, order(colors.DF[,1])), ]
colors.DF$ID <- 1:nrow(colors.DF)
breaks <- seq(1,nrow(colors.DF),length.out=10)


jpeg("CO2_Emissions.jpg",7000,5000,res=300)
plot(polygons,col=colorScale)
title("CO2 Emissions",cex.main=3)

legend.pos <- list(x=-28.52392,y=-20.59119)
legendg(legend.pos,legend=c(round(colors.DF[colors.DF$ID %in% round(breaks,0),1],2)),fill=paste(colors.DF[colors.DF$ID %in% round(breaks,0),2]),bty="n",bg=c("white"),y.intersp=0.75,title="Metric tons per capita",cex=0.8)

dev.off()


#INTERACTIVE MAPS
#googleVis PACKAGE
library(googleVis)

data.poly <- as.data.frame(polygons)
data.poly <- data.poly[,c(5,12)]
names(data.poly) <- c("Country Name","CO2 emissions (metric tons per capita)")

map <- gvisGeoMap(data=data.poly, locationvar = "Country Name", numvar='CO2 emissions (metric tons per capita)',options=list(width='800px',heigth='500px',colors="['0x0000ff', '0xff0000']"))
plot(map)

print(map,file="Map.html")

#http://www.javascripter.net/faq/rgbtohex.htm
#To find HEX codes for RGB colors


#plotGoogleMaps
library(plotGoogleMaps)

polygons.plot <- polygons[,c("CO2","GDP.capita","NAME")]
polygons.plot <- polygons.plot[polygons.plot$NAME!="Antarctica",]
names(polygons.plot) <- c("CO2 emissions (metric tons per capita)","GDP per capita (current US$)","Country Name")

#Full Page Map
map <- plotGoogleMaps(polygons.plot,zoom=4,fitBounds=F,filename="Map_GoogleMaps.html",layerName="Economic Data")


#To add this to an existing HTML page
map <- plotGoogleMaps(polygons.plot,zoom=2,fitBounds=F,filename="Map_GoogleMaps_small.html",layerName="Economic Data",map="GoogleMap",mapCanvas="Map",map.width="800px",map.height="600px",control.width="200px",control.height="600px")


R code snippets created by Pretty R at inside-R.org

To leave a comment for the author, please follow the link and comment on his blog: R Video tutorial for Spatial Statistics.

R-bloggers.com offers daily e-mail updates about R news and tutorials on topics such as: visualization (ggplot2, Boxplots, maps, animation), programming (RStudio, Sweave, LaTeX, SQL, Eclipse, git, hadoop, Web Scraping) statistics (regression, PCA, time series, trading) and more...
Tips & Tricks 9: Shape Changes and Hypothetical Shapes

$
0
0

(This article was first published on geomorph, and kindly contributed to R-bloggers)

Geomorph users,

This month’s tips and tricks was prompted by a user email from Tim Astrop, thanks Tim!


How can I create a hypothetical shape representing a point in shape space?

Today we will use some relatively simple R code to create a shape based on position in a Principal Component (PC) shape space and visualise this shape as a change from the mean using plotRefToTarget().

Exercise 9 – Creating hypothetical shapes


When you use plotTangentSpace() to visualise the variation among individuals in your dataset, two thin-plate spline (tps) deformation grids are plotted by default:
> data(plethodon)
> Y.gpa<-gpagen(plethodon$land)    #GPA-alignment
> gp <- as.factor(paste(plethodon$species, plethodon$site))

> PCA <- plotTangentSpace(Y.gpa$coords, groups = gp, verbose=T)

plotTangentSpace() example using plethodon dataset

These represent the shape change between the mean and the minimum PC1 score or maximum PC1 score. This is why the arrows point to the coordinates (max(PC1), 0) and (min(PC1), 0). They are made from the hypothetical shapes at the ends of the PC1 axis.

When you use verbose = T, a list called $pc.shapes is returned. In this list are the coordinates for the shapes at the minima and maxima of the two axes used in the plot (default PCs 1 and 2). These are returned so that you can plot these tps grids yourself using plotRefToTarget(), e.g.:

> ref <- mshape(Y.gpa$coords) # get mean shape

> plotRefToTarget(ref, PCA$pc.shapes$PC1max, method = “tps”)
> PCA$pc.shapes$PC1max
             [,1]         [,2]
 [1,]  0.14208576 -0.022246055
 [2,]  0.17904134 -0.088344179
 [3,] -0.02011384 -0.002132243
 [4,] -0.28076578 -0.088499525
 [5,] -0.30905960 -0.061152408
 [6,] -0.32381908 -0.036119622
 [7,] -0.31939430  0.031269185
 [8,] -0.19235878  0.099093107
 [9,]  0.01443297  0.106911342
[10,]  0.18138128  0.077532805
[11,]  0.39536788  0.058597759
[12,]  0.53320215 -0.074910167


How do we make this matrix above? 
First we do a PCA:
> pc.res <- prcomp(two.d.array(Y.gpa$coords))
> pcdata <- pc.res$x # save the PC scores
> rotation <- pc.res$rotation # save the rotation matrix
> k <- dim(Y.gpa$coords)[2] ; p <- dim(Y.gpa$coords)[1] # set number of dimensions and number of landmarks

Then we find the maximum value on PC1, first column of the pcdata matrix
> pcaxis.max.1 <- max(pcdata[, 1]) # find the maximum value on PC1, first column of the pc.scores
> pcaxis.max.1
[1] 0.05533109
Then we will create the shape at the point where max(PC1) and all other PCs are 0:
> pc.vec <- rep(0, dim(pcdata)[2]) # makes a vector of 0s as long as the number of PCs
pc.vec
 [1] 0 0 0 0 0 0 0 0 0 0 0 0 0 0 0 0 0 0 0 0 0 0 0 0
pc.vec[1] <- pcaxis.max.1 # put the value into this vector
pc.vec
 [1] 0.05533109 0.00000000 0.00000000 0.00000000 0.00000000 0.00000000 0.00000000
 [8] 0.00000000 0.00000000 0.00000000 0.00000000 0.00000000 0.00000000 0.00000000
[15] 0.00000000 0.00000000 0.00000000 0.00000000 0.00000000 0.00000000 0.00000000
[22] 0.00000000 0.00000000 0.00000000
> PC1max <- arrayspecs(as.matrix(pc.vec %*% (t(rotation))), p,k)[,,1] + ref 
Above we are doing a matrix multiplication (%*%) of the vector pc.vec and the transpose of the rotation matrix, making it into a p x k matrix using our arrayspecs function, and then adding in the mean shape we made earlier, so:
> PC1max
             [,1]         [,2]
 [1,]  0.14208576 -0.022246055
 [2,]  0.17904134 -0.088344179
 [3,] -0.02011384 -0.002132243
 [4,] -0.28076578 -0.088499525
 [5,] -0.30905960 -0.061152408
 [6,] -0.32381908 -0.036119622
 [7,] -0.31939430  0.031269185
 [8,] -0.19235878  0.099093107
 [9,]  0.01443297  0.106911342
[10,]  0.18138128  0.077532805
[11,]  0.39536788  0.058597759
[12,]  0.53320215 -0.074910167

The important part above is the pc.vec[1] <- pcaxis.max.1
If we had specified min of PC3, then it would be:

 [1]  0.00000000  0.00000000 -0.05190833  0.00000000  0.00000000  0.00000000
 [7]  0.00000000  0.00000000  0.00000000  0.00000000  0.00000000  0.00000000
[13]  0.00000000  0.00000000  0.00000000  0.00000000  0.00000000  0.00000000
[19]  0.00000000  0.00000000  0.00000000  0.00000000  0.00000000  0.00000000

In this way, it is possible to create any shape in the PC shape space, simply by adding in the coordinates into the vector we call here pc.vec.

Further reading: Rohlf, F.J., 1996. Morphometric spaces, shape components and the effects of linear transformations. In L. F. Marcus et al., eds. Advances in Morphometrics. NY: Plenum Press, pp. 117–130.

Enjoy!
Emma

To leave a comment for the author, please follow the link and comment on his blog: geomorph.

R-bloggers.com offers daily e-mail updates about R news and tutorials on topics such as: visualization (ggplot2, Boxplots, maps, animation), programming (RStudio, Sweave, LaTeX, SQL, Eclipse, git, hadoop, Web Scraping) statistics (regression, PCA, time series, trading) and more...
Pull the (character) strings with stringi 0.5-2

$
0
0

(This article was first published on Rexamine » Blog/R-bloggers, and kindly contributed to R-bloggers)

A reliable string processing toolkit is a must-have for any data scientist.

A new release of the stringi package is available on CRAN (please wait a few days for Windows and OS X binary builds). As for now, about 850 CRAN packages depend (either directly or recursively) on stringi. And quite recently, the package got listed among the top downloaded R extensions.

# install.packages("stringi") or update.packages()
library("stringi")
stri_info(TRUE)
## [1] "stringi_0.5.2; en_US.UTF-8; ICU4C 55.1; Unicode 7.0"
apkg <- available.packages(contriburl="http://cran.rstudio.com/src/contrib")
length(tools::dependsOnPkgs('stringi', installed=apkg, recursive=TRUE))
## [1] 845

Refer to the INSTALL file for more details if you compile stringi from sources (Linux users mostly).

Here’s a list of changes in version 0.5-2. There are many major (like date&time processing) and minor new features, enhancements, as well as bugfixes. In the current release we also focused on bringing stringr package’s users even better string processing experience, as since the 1.0.0 release it is now powered by stringi.

  • [BACKWARD INCOMPATIBILITY] The second argument to stri_pad_*() has been renamed width.

  • [GENERAL] #69: stringi is now bundled with ICU4C 55.1.

  • [NEW FUNCTIONS] #137: date-time formatting/parsing (note that this is draft API and it may change in future stringi releases; any comments are welcome):
    • stri_timezone_list() – lists all known time zone identifiers
    sample(stri_timezone_list(), 10)
    ##  [1] "Etc/GMT+12"                  "Antarctica/Macquarie"       
    ##  [3] "Atlantic/Faroe"              "Antarctica/Troll"           
    ##  [5] "America/Fort_Wayne"          "PLT"                        
    ##  [7] "America/Goose_Bay"           "America/Argentina/Catamarca"
    ##  [9] "Africa/Juba"                 "Africa/Bissau"
    • stri_timezone_set(), stri_timezone_get() – manage current default time zone
    • stri_timezone_info() – basic information on a given time zone
    str(stri_timezone_info('Europe/Warsaw'))
    ## List of 6
    ##  $ ID              : chr "Europe/Warsaw"
    ##  $ Name            : chr "Central European Standard Time"
    ##  $ Name.Daylight   : chr "Central European Summer Time"
    ##  $ Name.Windows    : chr "Central European Standard Time"
    ##  $ RawOffset       : num 1
    ##  $ UsesDaylightTime: logi TRUE
    stri_timezone_info('Europe/Warsaw', locale='de_DE')$Name
    ## [1] "Mitteleuropäische Normalzeit"
    • stri_datetime_symbols() – localizable date-time formatting data
    stri_datetime_symbols()
    ## $Month
    ##  [1] "January"   "February"  "March"     "April"     "May"      
    ##  [6] "June"      "July"      "August"    "September" "October"  
    ## [11] "November"  "December" 
    ## 
    ## $Weekday
    ## [1] "Sunday"    "Monday"    "Tuesday"   "Wednesday" "Thursday"  "Friday"   
    ## [7] "Saturday" 
    ## 
    ## $Quarter
    ## [1] "1st quarter" "2nd quarter" "3rd quarter" "4th quarter"
    ## 
    ## $AmPm
    ## [1] "AM" "PM"
    ## 
    ## $Era
    ## [1] "Before Christ" "Anno Domini"
    stri_datetime_symbols("th_TH_TRADITIONAL")$Month
    ##  [1] "มกราคม"  "กุมภาพันธ์"    "มีนาคม"    "เมษายน"  "พฤษภาคม" "มิถุนายน"    "กรกฎาคม"
    ##  [8] "สิงหาคม"   "กันยายน"   "ตุลาคม"    "พฤศจิกายน" "ธันวาคม"
    stri_datetime_symbols("he_IL@calendar=hebrew")$Month
    ##  [1] "תשרי"   "חשון"   "כסלו"   "טבת"    "שבט"    "אדר א׳" "אדר"   
    ##  [8] "ניסן"   "אייר"   "סיון"   "תמוז"   "אב"     "אלול"   "אדר ב׳"
    • stri_datetime_now() – return current date-time
    • stri_datetime_fstr() – convert a strptime-like format string to an ICU date/time format string
    • stri_datetime_format() – convert date/time to string
        stri_datetime_format(stri_datetime_now(), "datetime_relative_medium")
    ## [1] "today, 6:21:45 PM"
    • stri_datetime_parse() – convert string to date/time object
    stri_datetime_parse(c("2015-02-28", "2015-02-29"), "yyyy-MM-dd")
    ## [1] "2015-02-28 18:21:45 CET" NA
    stri_datetime_parse(c("2015-02-28", "2015-02-29"), stri_datetime_fstr("%Y-%m-%d"))
    ## [1] "2015-02-28 18:21:45 CET" NA
    stri_datetime_parse(c("2015-02-28", "2015-02-29"), "yyyy-MM-dd", lenient=TRUE)
    ## [1] "2015-02-28 18:21:45 CET" "2015-03-01 18:21:45 CET"
    stri_datetime_parse("19 lipca 2015", "date_long", locale="pl_PL")
    ## [1] "2015-07-19 18:21:45 CEST"
    • stri_datetime_create() – construct date-time objects from numeric representations
    stri_datetime_create(2015, 12, 31, 23, 59, 59.999)
    ## [1] "2015-12-31 23:59:59 CET"
    stri_datetime_create(5775, 8, 1, locale="@calendar=hebrew") # 1 Nisan 5775 -> 2015-03-21
    ## [1] "2015-03-21 12:00:00 CET"
    stri_datetime_create(2015, 02, 29)
    ## [1] NA
    stri_datetime_create(2015, 02, 29, lenient=TRUE)
    ## [1] "2015-03-01 12:00:00 CET"
    • stri_datetime_fields() – get values for date-time fields
    stri_datetime_fields(stri_datetime_now())
    ##   Year Month Day Hour Minute Second Millisecond WeekOfYear WeekOfMonth
    ## 1 2015     6  23   18     21     45          52         26           4
    ##   DayOfYear DayOfWeek Hour12 AmPm Era
    ## 1       174         3      6    2   2
       stri_datetime_fields(stri_datetime_now(), locale="@calendar=hebrew")
    ##   Year Month Day Hour Minute Second Millisecond WeekOfYear WeekOfMonth
    ## 1 5775    11   6   18     21     45          56         40           2
    ##   DayOfYear DayOfWeek Hour12 AmPm Era
    ## 1       272         3      6    2   1
       stri_datetime_symbols(locale="@calendar=hebrew")$Month[
      stri_datetime_fields(stri_datetime_now(), locale="@calendar=hebrew")$Month
       ]
    ## [1] "Tamuz"
    • stri_datetime_add() – add specific number of date-time units to a date-time object
    x <- stri_datetime_create(2015, 12, 31, 23, 59, 59.999)
    stri_datetime_add(x, units="months") <- 2
    print(x)
    ## [1] "2016-02-29 23:59:59 CET"
    stri_datetime_add(x, -2, units="months")
    ## [1] "2015-12-29 23:59:59 CET"
  • [NEW FUNCTIONS] stri_extract_*_boundaries() extract text between text boundaries.

  • [NEW FUNCTION] #46: stri_trans_char() is a stringi-flavoured chartr() equivalent.

stri_trans_char("id.123", ".", "_")
## [1] "id_123"
stri_trans_char("babaab", "ab", "01")
## [1] "101001"
  • [NEW FUNCTION] #8: stri_width() approximates the width of a string in a more Unicodish fashion than nchar(..., "width")
stri_width(LETTERS[1:5])
## [1] 1 1 1 1 1
nchar(stri_trans_nfkd("u0105"), "width") # provides incorrect information
## [1] 0
stri_width(stri_trans_nfkd("u0105")) # A and ogonek (width = 1)
## [1] 1
stri_width( # Full-width equivalents of ASCII characters:
   stri_enc_fromutf32(as.list(c(0x3000, 0xFF01:0xFF5E)))
)
##  [1] 2 2 2 2 2 2 2 2 2 2 2 2 2 2 2 2 2 2 2 2 2 2 2 2 2 2 2 2 2 2 2 2 2 2 2
## [36] 2 2 2 2 2 2 2 2 2 2 2 2 2 2 2 2 2 2 2 2 2 2 2 2 2 2 2 2 2 2 2 2 2 2 2
## [71] 2 2 2 2 2 2 2 2 2 2 2 2 2 2 2 2 2 2 2 2 2 2 2 2 2
  • [NEW FEATURE] #149: stri_pad() and stri_wrap() now by default bases on code point widths instead of the number of code points. Moreover, the default behavior of stri_wrap() is now such that it does not get rid of non-breaking, zero width, etc. spaces
x <- stri_flatten(c(
   stri_dup(LETTERS, 2),
   stri_enc_fromutf32(as.list(0xFF21:0xFF3a))
), collapse=' ')
# Note that your web browser may have problems with properly aligning
# this (try it in RStudio)
cat(stri_wrap(x, 11), sep='n')
## AA BB CC DD
## EE FF GG HH
## II JJ KK LL
## MM NN OO PP
## QQ RR SS TT
## UU VV WW XX
## YY ZZ A B
## C D E F
## G H I J
## K L M N
## O P Q R
## S T U V
## W X Y Z
  • [NEW FEATURE] #133: stri_wrap() silently allows for width <= 0 (for compatibility with strwrap()).

  • [NEW FEATURE] #139: stri_wrap() gained a new argument: whitespace_only.

  • [GENERAL] #144: Performance improvements in handling ASCII strings (these affect stri_sub(), stri_locate() and other string index-based operations)

  • [GENERAL] #143: Searching for short fixed patterns (stri_*_fixed()) now relies on the current libC’s implementation of strchr() and strstr(). This is very fast e.g. on glibc utilizing the SSE2/3/4 instruction set.

x <- stri_rand_strings(100, 10000, "[actg]")
microbenchmark::microbenchmark(
   stri_detect_fixed(x, "acgtgaa"),
   grepl("actggact", x),
   grepl("actggact", x, perl=TRUE),
   grepl("actggact", x, fixed=TRUE)
)
## Unit: microseconds
##                                expr       min        lq       mean
##     stri_detect_fixed(x, "acgtgaa")   349.153   354.181   381.2391
##                grepl("actggact", x) 14017.923 14181.416 14457.3996
##   grepl("actggact", x, perl = TRUE)  8280.282  8367.426  8516.0124
##  grepl("actggact", x, fixed = TRUE)  3599.200  3637.373  3726.6020
##      median         uq       max neval  cld
##    362.7515   391.0655   681.267   100 a   
##  14292.2815 14594.4970 15736.535   100    d
##   8463.4490  8570.0080  9564.503   100   c 
##   3686.6690  3753.4060  4402.397   100  b
  • [GENERAL] #141: a local copy of icudt*.zip may be used on package install; see the INSTALL file for more information.

  • [GENERAL] #165: the ./configure option --disable-icu-bundle forces the use of system ICU when building the package.

  • [BUGFIX] locale specifiers are now normalized in a more intelligent way: e.g. @calendar=gregorian expands to DEFAULT_LOCALE@calendar=gregorian.

  • [BUGFIX] #134: stri_extract_all_words() did not accept simplify=NA.

  • [BUGFIX] #132: incorrect behavior in stri_locate_regex() for matches of zero lengths.

  • [BUGFIX] stringr/#73: stri_wrap() returned CHARSXP instead of STRSXP on empty string input with simplify=FALSE argument.

  • [BUGFIX] #164: libicu-dev usage used to fail on Ubuntu.

  • [BUGFIX] #135: C++11 is now used by default (see the INSTALL file, however) to build stringi from sources. This is because ICU4C uses the long long type which is not part of the C++98 standard.

  • [BUGFIX] #154: Dates and other objects with a custom class attribute were not coerced to the character type correctly.

  • [BUGFIX] #168: Build now fails if icudt is not available.

  • [BUGFIX] Force ICU u_init() call on stringi dynlib load.

  • [BUGFIX] #157: many overfull hboxes in the package PDF manual has been corrected.

Enjoy! Any comments and suggestions are welcome.

To leave a comment for the author, please follow the link and comment on his blog: Rexamine » Blog/R-bloggers.

R-bloggers.com offers daily e-mail updates about R news and tutorials on topics such as: visualization (ggplot2, Boxplots, maps, animation), programming (RStudio, Sweave, LaTeX, SQL, Eclipse, git, hadoop, Web Scraping) statistics (regression, PCA, time series, trading) and more...
Seattle’s Fremont Bridge Bicyclists Again in the News

$
0
0

(This article was first published on Notes of a Dabbler » R, and kindly contributed to R-bloggers)

Back in 2013, David Smith had done analysis of bicycle trips across Seattle’s Fremont bridge. More recently, Jake Vanderplas (creator of Python’s
very popular Scikit-learn package) wrote a nice blog post on
“Learning Seattle Work habits from bicycle counts” at Fremont bridge.

I wanted to work through Jake’s analysis using R since I am learning R. Please read the original article by Jake to get the full context and thinking behind the analysis. For folks interested in Python, Jake has provided link in the blog post to iPython notebook where you can work through the analysis in Python (and learn some key Python modules: pandas, matplotlib, sklearn along the way)

The R code that I used to work through the analysis is in the following link.

Below are some key results/graphs.
1. Doing a PCA analysis on bicycle count data (where each row is a day and columns are 24 hr bicycle counts from East and West side) shows that 2 components can explain 90% of variance. The scores plot of first 2 principal components indicates 2 clusters. Coloring the scores by day of week suggest a weekday cluster and a weekend cluster

scoresbyWkday

  1. The average bike counts for each cluster and side (East/West) better shows the patterns for weekday and weekend commute (weekday commute peaks in the morning and evening)
    clusterAvg
  2. While this was not in the original post, looking at the loadings of the first 2 principal components also suggests the weekday vs weekend interpretation of clusters.
    pcLoadings

Thanks again to Jake Vanderplas for the analysis and illustrating how lot of insights could be gathered from data.

To leave a comment for the author, please follow the link and comment on his blog: Notes of a Dabbler » R.

R-bloggers.com offers daily e-mail updates about R news and tutorials on topics such as: visualization (ggplot2, Boxplots, maps, animation), programming (RStudio, Sweave, LaTeX, SQL, Eclipse, git, hadoop, Web Scraping) statistics (regression, PCA, time series, trading) and more...
Feature Engineering versus Feature Extraction: Game On!

$
0
0

(This article was first published on Blog - Applied Predictive Modeling, and kindly contributed to R-bloggers)

“Feature engineering” is a fancy term for making sure that your predictors are encoded in the model in a manner that makes it as easy as possible for the model to achieve good performance. For example, if your have a date field as a predictor and there are larger differences in response for the weekends versus the weekdays, then encoding the date in this way makes it easier to achieve good results.

However, this depends on a lot of things.

First, it is model-dependent. For example, trees might have trouble with a classification data set if the class boundary is a diagonal line since their class boundaries are made using orthogonal slices of the data (oblique trees excepted).

Second, the process of predictor encoding benefits the most from subject-specific knowledge of the problem. In my example above, you need to know the patterns of your data to improve the format of the predictor. Feature engineering is very different in image processing, information retrieval, RNA expressions profiling, etc. You need to know something about the problem and your particular data set to do it well.

Here is some training set data where two predictors are used to model a two-class system (I’ll unblind the data at the end):

There is also a corresponding test set that we will use below.

There are some observations that we can make:

  • The data are highly correlated (correlation = 0.85)
  • Each predictor appears to be fairly right-skewed
  • They appear to be informative in the sense that you might be able to draw a diagonal line to differentiate the classes

Depending on what model that we might choose to use, the between-predictor correlation might bother us. Also, we should look to see of the individual predictors are important. To measure this, we’ll use the area under the ROC curve on the predictor data directly.

Here are univariate box-plots of each predictor (on the log scale):

There is some mild differentiation between the classes but a significant amount of overlap in the boxes. The area under the ROC curves for predictor A and B are 0.61 and 0.59, respectively. Not so fantastic.

What can we do? Principal component analysis (PCA) is a pre-processing method that does a rotation of the predictor data in a manner that creates new synthetic predictors (i.e. the principal components or PC’s). This is conducted in a way where the first component accounts for the majority of the (linear) variation or information in the predictor data. The second component does the same for any information in the data that remains after extracting the first component and so on. For these data, there are two possible components (since there are only two predictors). Using PCA in this manner is typically called feature extraction.

Let’s compute the components:


> library(caret)
> head(example_train)
   PredictorA PredictorB Class
2    3278.726  154.89876   One
3    1727.410   84.56460   Two
4    1194.932  101.09107   One
12   1027.222   68.71062   Two
15   1035.608   73.40559   One
16   1433.918   79.47569   One


> pca_pp <- preProcess(example_train[, 1:2],
+                      method = c("center", "scale", "pca"))
+ pca_pp

Call:
preProcess.default(x = example_train[, 1:2], method = c("center",
 "scale", "pca"))

Created from 1009 samples and 2 variables
Pre-processing: centered, scaled, principal component signal extraction 

PCA needed 2 components to capture 95 percent of the variance


> train_pc <- predict(pca_pp, example_train[, 1:2])
> test_pc <- predict(pca_pp, example_test[, 1:2])
> head(test_pc, 4)
        PC1         PC2
1 0.8420447  0.07284802
5 0.2189168  0.04568417
6 1.2074404 -0.21040558
7 1.1794578 -0.20980371

Note that we computed all the necessary information from the training set and apply these calculations to the test set. What do the test set data look like?

These are the test set predictors simply rotated.

PCA is unsupervised, meaning that the outcome classes are not considered when the calculations are done. Here, the area under the ROC curves for the first component is 0.5 and 0.81 for the second component. These results jive with the plot above; the first component has an random mixture of the classes while the second seems to separate the classes well. Box plots of the two components reflect the same thing:

There is much more separation in the second component.

This is interesting. First, despite PCA being unsupervised, it managed to find a new predictor that differentiates the classes. Secondly, it is the last component that is most important to the classes but the least important to the predictors. It is often said that PCA doesn’t guarantee that any of the components will be predictive and this is true. Here, we get lucky and it does produce something good.

However, imagine that there are hundreds of predictors. We may only need to use the first X components to capture the majority of the information in the predictors and, in doing so, discard the later components. In this example, the first component accounts for 92.4% of the variation in the predictors; a similar strategy would probably discard the most effective predictor.

How does the idea of feature engineering come into play here? Given these two predictors and seeing the first scatterplot shown above, one of the first things that occurs to me is “there are two correlated, positive, skewed predictors that appear to act in tandem to differentiate the classes”. The second thing that occurs to be is “take the ratio”. What does that data look like?

The corresponding area under the ROC curve is 0.8, which is nearly as good as the second component. A simple transformation based on visually exploring the data can do just as good of a job as an unbiased empirical algorithm.

These data are from the cell segmentation experiment of Hill et al, and predictor A is the “surface of a sphere created from by rotating the equivalent circle about its diameter” (labeled as EqSphereAreaCh1 in the data) and predictor B is the perimeter of the cell nucleus (PerimCh1). A specialist in high content screening might naturally take the ratio of these two features of cells because it makes good scientific sense (I am not that person). In the context of the problem, their intuition should drive the feature engineering process.

However, in defense of an algorithm such as PCA, the machine has some benefit. In total, there are almost sixty predictors in these data whose features are just as arcane as EqSphereAreaCh1. My personal favorite is the “Haralick texture measurement of the spatial arrangement of pixels based on the co-occurrence matrix”. Look that one up some time. The point is that there are often too many features to engineer and they might be completely unintuitive from the start.

Another plus for feature extraction is related to correlation. The predictors in this particular data set tend to have high between-predictor correlations and for good reasons. For example, there are many different ways to quantify the eccentricity of a cell (i.e. how elongated it is). Also, the size of a cell’s nucleus is probably correlated with the size of the overall cell and so on. PCA can mitigate the effect of these correlations in one fell swoop. An approach of manually taking ratios of many predictors seems less likely to be effective and would take more time.

Last year, in one of the R&D groups that I support, there was a bit of a war being waged between the scientists who focused on biased analysis (i.e. we model what we know) versus the unbiased crowd (i.e. just let the machine figure it out). I fit somewhere in-between and believe that there is a feedback loop between the two. The machine can flag potentially new and interesting features that, once explored, become part of the standard book of “known stuff”.

To leave a comment for the author, please follow the link and comment on his blog: Blog - Applied Predictive Modeling.

R-bloggers.com offers daily e-mail updates about R news and tutorials on topics such as: visualization (ggplot2, Boxplots, maps, animation), programming (RStudio, Sweave, LaTeX, SQL, Eclipse, git, hadoop, Web Scraping) statistics (regression, PCA, time series, trading) and more...
Multivariate Techniques in Python: EcoPy Alpha Launch!

$
0
0

(This article was first published on Climate Change Ecology » R, and kindly contributed to R-bloggers)

I’m announcing the alpha launch of EcoPy: Ecological Data Analysis in Python. EcoPy is a Python module that contains a number of  techniques (PCA, CA, CCorA, nMDS, MDS, RDA, etc.) for exploring complex multivariate data. For those of you familiar with R, think of this as the Python equivalent to the ‘vegan‘ package.

However, I’m not done! This is the alpha launch, which means you should exercise caution before using this package for research. I’ve stress-tested a couple of simple examples to ensure I get equivalent output in numerous programs, but I haven’t tested it out with real, messy data yet. There might be broken bits or quirks I don’t know about. For the moment, be sure to verify your results with other software.

That said, I need help! My coding might be sloppy, or you might find errors that I didn’t, or you might suggest improvements to the interface. If you want to contribute, either by helping with coding or stress-testing on real-world examples, let me know. The module is available on github and full documentation is available at readthedocs.org.

To leave a comment for the author, please follow the link and comment on his blog: Climate Change Ecology » R.

R-bloggers.com offers daily e-mail updates about R news and tutorials on topics such as: visualization (ggplot2, Boxplots, maps, animation), programming (RStudio, Sweave, LaTeX, SQL, Eclipse, git, hadoop, Web Scraping) statistics (regression, PCA, time series, trading) and more...
partools: a Sensible R Package for Large Data Sets

$
0
0

(This article was first published on Mad (Data) Scientist, and kindly contributed to R-bloggers)

As I mentioned recently, the new, greatly extended version of my partools package is now on CRAN. (The current version on CRAN is 1.1.3, whereas at the time of my previous announcement it was only 1.1.1. Note that Unix is NOT required.)

It is my contention that for most R users who work with large data,  partools — or methods like it — is a better, simpler, far more convenient approach than Hadoop and Spark.  If you are an R user and, like most Hadoop/Spark users, don’t have a mega cluster (thousands of nodes), partools is a sensible alternative to Hadoop and Spark.

I’ll introduce partools usage in this post. I encourage comments (pro or con, here or in private). In particular, for those of you attending the JSM next week, I’d be happy to discuss the package in person, and hear your comments, feature requests and so on.

Why do I refer to partools as “sensible”? Consider:

  • Hadoop and Spark are quite difficult to install and configure, especially for non-computer systems experts. By contrast, partools just uses ordinary R; there is nothing to set up.
  • Spark, currently much favored  by many over Hadoop, involves new, complex and abstract programming paradigms, even under the R interface, SparkR. By contrast, again, partools just uses ordinary R.
  • Hadoop and Spark, especially the latter, have excellent fault tolerance features. If you have a cluster consisting of thousands of nodes, the possibility of disk failure must be considered. But otherwise, the fault tolerance of Hadoop and Spark are just slowing down your computation, often radically so.  (You could also do your own fault tolerance, ranging from simple backup to sophisticated systems such as Xtreemfs.)

What Hadoop and Spark get right is to base computation on distributed files. Instead of storing data in a monolithic file x, it is stored in chunks, say x.01, x.02,…, which can greatly reduce network overhead in the computation. The partools package also adopts this philosophy.

Overview of  partools:

  • There is no “magic.”  The package merely consists of short, simple uitiliies that make use of R’s parallel package.
  • The key philosophy is Keep It Distributed (KID). Under KID, one does many distributed operations,, with a collective operation being doing occasionally, when needed.

Sample partools (PT) session (see package vignette for details, including code, output):

  • 16-core machine.
  • Flight delay data, 2008. Distributed file created previously from monolithic one  via PT’s filesplit().
  • Called PT’s fileread(), causing each cluster node to read its chunk of the big file.
  •  Called PT’s distribagg() to find max values of DepDelay, ArrDelay, Airtime. 15.952 seconds, vs. 249.634 for R’s serial aggregate().
  • Interested in Sunday evening flights.  Each node performs that filtering op, assigning to data frame sundayeve. Note that that is a distributed data frame, in keeping with KID.
  • Continue with KID, but if later we want to un-distribute that data frame, we could call PT’s distribgetrows().
  • Performed a linear regression analysis, predicting ArrDelay from DepDelay and Distance, using Software Alchemy, via PT’s calm() function. Took 18.396 seconds, vs. 76.225 for ordinary lm(). (See my new book, Parallel Computation for Data Science, for details on Software Alchemy.)
  • Did a distributed na.omit() to each chunk, using parallel‘s clusterEvalQ(). Took 2.352 seconds, compared to 9.907 it would have needed if not distributed.
  • Performed PCA. Took 8.949 seconds for PT’s caprcomp(), vs. 58.444 for the non-distributed case.
  • Calculated interquartile range for each of 12 variables, taking 2.587 seconds, compared to 29.584 for the non-distributed case.
  • Performed a more elaborate  distributed na.omit(), in time 9.293, compared to 55.032 in the serial case.

Again, see the vignette for details on the above, on how to deal with files that don’t fit into memory etc.

To leave a comment for the author, please follow the link and comment on his blog: Mad (Data) Scientist.

R-bloggers.com offers daily e-mail updates about R news and tutorials on topics such as: visualization (ggplot2, Boxplots, maps, animation), programming (RStudio, Sweave, LaTeX, SQL, Eclipse, git, hadoop, Web Scraping) statistics (regression, PCA, time series, trading) and more...
Matrix Factorization Comes in Many Flavors: Components, Clusters, Building Blocks and Ideals

$
0
0

(This article was first published on Engaging Market Research, and kindly contributed to R-bloggers)

Unsupervised learning is covered in Chapter 14 of The Elements of Statistical Learning. Here we learn about several data reduction techniques including principal component analysis (PCA), K-means clustering, nonnegative matrix factorization (NMF) and archetypal analysis (AA). Although on the surface they seem so different, each is a data approximation technique using matrix factorization with different constraints. We can learn a great deal if we compare and contrast these four major forms of matrix factorization.

Robert Tibshirani outlines some of these interconnections in a group of slides from one of his lectures. If there are still questions, Christian Thurau’s YouTube video should provide the answers. His talk is titled “Low-Rank Matrix Approximations in Python,” yet the only Python you will see is a couple of function calls that look very familiar. R, of course, has many ways of doing K-means and principal component analysis. In addition, I have posts showing how to run nonnegative matrix factorization and archetypal analysis in R.

As a reminder, supervised learning also attempts to approximate the data, in this case the Ys given the Xs. In multivariate multiple regression, we have many dependent variables so that both Y and B are matrices instead of vectors. The usual equation remains Y = XB + E, except that Y, B and E are all matrices with as many rows as the number of observations and as many columns as the number of outcome variables. The error is made as small as possible as we try to reproduce our set of dependent variables as closely as possible from the observed Xs.

K-means and PCA

Without predictors we lose our supervision and are left to search for redundancies or patterns in our Ys without any Xs. We are free to test alternative data generation processes. For example, can variation be explained by the presence of clusters? As shown in the YouTube video and the accompanying slides from the presentation, the data matrix (V) can be reproduced by the product of a cluster membership matrix (W) and a matrix of cluster centroids (H). Each row of W contains all zeros except for a single one that stamps out that cluster profile. With K-means, for instance, cluster membership is all-or-none with each cluster represented by a complete profile of averages calculated across every object in the cluster. The error is the extent that the observations in each grouping differs from their cluster profile.

Principal component analysis works in a similar fashion, but now the rows of W are principal component scores and H holds the principal component loadings. In both PCA and K-means, V = WH but with different constraints on W and H. W is no longer all zeros except for a single one, and H is not a collection of cluster profiles. Instead, H contains the coefficients defining an orthogonal basis for the data cloud with each successive dimension accounting for a decreasing proportion of the total variation, and W tells us how much each dimension contributes to the observed data for every observation.

An early application to intelligence testing serves as a good illustration. Test scores tend to be correlated positively so that all the coefficients in H for the first principal component will be positive. If the tests include more highly intercorrelated verbal or reading scores along with more highly intercorrelated quantitative or math scores, then the second principal component will be bipolar with positive coefficients for verbal variables and negative coefficients for quantitative variables. You should note that the signs can be reversed for any row of H for such reversal only changes direction. Finally, W tells us the impact of each principal component on the observed test scores in data matrix V.

Smart test takers have higher first principal components that uniformly increase all the scores. Those with higher verbal than quantitative skills will also have higher positive values for their second principal component. Given its bipolar coefficients, this will raise the scores on the verbal test and lower the scores on the quantitative tests. And that is how PCA reproduces the observed data matrix.

We can use the R package FactoMineR to plot the features (columns) and objects (rows) in the same space. The same analysis can be performed using the biplot function in R, but FactoMineR offers much more and supports it all with documentation. I have borrowed these two plot from an earlier post, Using Biplots to Map Cluster Solutions.

FactoMineR separates the variables and the individuals in order not to overcrowd the maps. As you can see from the percent contributions of the two dimensions, this is the same space so that you can overlay the two plots (e.g., the red data points are those with the highest projection onto the Floral and Sweetness vectors). One should remember that vector spaces are shown with arrows, and scores on those variables are reproduced as orthogonal projections onto each vector.

The prior post attempted to show the relationship between a cluster and a principal component solution. PCA relies on a “new” dimensional space obtained through linear combinations of the original variables. On the other hand, clusters are a discrete representation. The red points in the above individual factor map are similar because they are of the same type with any differences among these red dots due to error. For example, sweet and sour (medicinal on the plot) are taste types with their own taste buds. However, sweet and sour are perceived as opposites so that the two clusters can be connected using a line with sweet-and-sour tastes located between the extremes. Dimensions always can be reframed as convex combinations of discrete categories, rendering the qualitative-quantitative distinction somewhat less meaningful.

NMF and AA

It may come as no surprise to learn that nonnegative matrix factorization, given it is nonnegative, has the same form with all the elements of V, W, and H constrained to be zero or positive. The result is that W becomes a composition matrix with nonzero values in a row picking the elements of H as parts of the whole being composed. Unlike PCA where H may represent contrasts of positive and negative variable weights, H can only be zero or positive in NMF. As a result, H bundles together variables to form weighted composites.

The columns of W and the rows of H represent the latent feature bundles that are believed to be responsible for the observed data in V. The building blocks are not individual features but weighted bundles of features that serve a common purpose. One might think of the latent bundles using a “tools in the toolbox” metaphor. You can find a detailed description showing each step in the process in a previous post and many examples with the needed R code throughout this blog.

Archetypal analysis is another variation on the matrix factorization theme with the observed data formed as convex combinations of extremes on the hull that surrounds the point cloud of observations. Therefore, the profiles of these extremes or ideals are the rows of H and can be interpreted as representing opposites at the edge of the data cloud. Interpretation seems to come naturally since we tend to think in terms of contrasting ideals (e.g., sweet-sour and liberal-conservative).

This is the picture used in my original archetypal analysis post to illustrate the point cloud, the variables projected as vectors onto the same space, and the locations of the 3 archetypes (A1, A2, A3) compared with the placement of the 3 K-means centroids (K1, K2, K3). The archetypes are positioned as vertices of a triangle spanning the two-dimensional space with every point lying within this simplex. In contrast, the K-means centroids are pulled more toward the center and away from the periphery.

Why So Many Flavors of Matrix Factorization?

We try to make sense of our data by understanding the underlying process that generated that data. Matrix factorization serves us well as a general framework. If every variable was mutually independent of all the rest, we would not require a matrix H to extract latent variables. Moreover, if every latent variable had the same impact for every observation, we would not require a matrix W holding differential contributions. The equation V = WH represents that the observed data arises from two sources: W that can be interpreted as if it were a matrix of latent scores and H that serves as a matrix of latent loadings. H defines the relationship between observed and latent variables. W represents the contributions of the latent variables for every observation. We call this process matrix factorization or matrix decomposition for obvious reasons.

Each of the four matrix factorizations adds some type of constraint in order to obtain a W and H. Each constraint provides a different view of the data matrix. PCA is a variance-maximizers yielding a set of components accounting for the most variation independent of all preceding components. K-means gives us boxes with minimum variation within each box. We get building blocks and individualized rules of assembly from NMF. Finally, AA frames observations as compromises among ideals or archetypes. The data analyst must decide which story best fits their data.

To leave a comment for the author, please follow the link and comment on his blog: Engaging Market Research.

R-bloggers.com offers daily e-mail updates about R news and tutorials on topics such as: visualization (ggplot2, Boxplots, maps, animation), programming (RStudio, Sweave, LaTeX, SQL, Eclipse, git, hadoop, Web Scraping) statistics (regression, PCA, time series, trading) and more...
R News From JSM 2015

$
0
0

(This article was first published on Revolutions, and kindly contributed to R-bloggers)

by Joseph Rickert

We can declare 2015 the year that R went mainstream at the JSM. There is no doubt about it, the calculations, visualizations and deep thinking of a great many of the world's statisticians are rendered or expressed in R and the JSM is with the program. In 2013 I was happy to have stumbled into a talk where an FDA statistician confirmed that R was indeed a much used and trusted tool. Last year, while preparing to attend the conference, I was delighted to find a substantial list of R and data science related talks. This year, talks not only mentioned R: they were about R.

Rbooks
R was everywhere!

The conference began with several R focused pre-conference tutorials including Statistical Analysis of Financial Data Using R, The Art and Science of Data Visualization Using R, and Hadley Wickham’s sold out Advanced R. The Sunday afternoon session on Advances in R Software played to a full room. Highlights of that session included Gabe Becker’s presentation on the switchr package for reproducible research, Mark Seligman’s update on the new work being done on the Arborist implementation of the random forest algorithm and my colleague’s Andrie de Vries presentation of some work we did on the network structure of R packages. (See yesterday’s post.)

The enthusiasm expressed by the overflowing crowd for Monday’s invited session on Recent Advances in Interactive Graphics for Data Analysis was contagious. Talks revolved around several packages linking R graphics to d3 and JavaScript in order to provide interactive graphics which are not only visually stunning but also open up new possibilities for exploratory data analysis. Hadley Wickham, the substitute chair for the session, characterized the various approaches to achieving interactive graphics in R with a bit of humor and much insight that I think brings some clarity to this chaotic whorl of development. Hadley places current efforts to provide interactive R graphics in one of three categories:

  • Speaking in tongues: interfacing to low level specialized languages (examples: iplots and rggobi)
  • Hacking existing graphics (examples: Animint and using ggplot2 with Shiny)
  • Abusing the browser (examples: R/qtlcharts, leaflet and htmlwidgets)

Other highlights of the session included Kenney Shirley’s presentation on interactively visualizing trees with his summarytrees package that interfaces R to D3,  Susan VanderPlas’ presentation of Animint (This package adds interactive aesthetics to ggplot2. Here is a nice tutorial.), and Karl Bowman’s discussion of visualizing high-dimensional genomic data (See qtlcharts and d3examples.)

In addition to visualization, education was another thread that stitched together various R related topics. Waller's talk, Evaluating Data Science Contributions in Teaching and Research, in the section of invited papers: The Statistics Identity Crisis: Are We Really Data Scientists provided some advice on how software developed by academics could be “packaged” to look like the more traditional work product traditionally valued for academic advancement. Progress along these lines would go a long way towards helping some of the most productive R contributors achieve career advancing recognition. There was also some considerable discussion about the kind of practical R and data science skills that should supplement the theoretical training of statisticians to help them be effective in academia as well as in industry. To get some insight into the relevant issues have a look at Jennifer Bryan’s slides for her talk Teach Data Science and They Will Come.

The following list contains 20 JSM talks with interesting package, educational or application R content.

  1. Animint: Interactive Web-Based Animations Using Ggplot2's Grammar of Graphics
    Susan Ruth VanderPlas, Iowa State University; Carson Sievert, Iowa State University; Toby Hocking, McGill University
  2. Applying the R Language in Streaming and Business Intelligence Applications
    Louis Bajuk, TIBCO Software Inc.
  3. A Bayesian Test of Independence of Two Categorical Variables with Covariates
    Dilli Bhatta, Truman State University
  4. Comparison of R and Vowpal Wabbit for Click Prediction in Display Advertising
    Jaimyoung Kwon, AOL Advertising; Bin Ren, AOL Platforms; Rajasekhar Cherukuri, AOL Platforms; Marius Holtan, AOL Platforms
  5. Demonstration of Statistical Concepts with Animated Graphics and Simulations in R
    Andrej Blejec, National Institute of Biology
  6. The Dendextend R Package for Manipulation, Visualization, and Comparison of Dendograms
    Tal Galili, Tel Aviv University
  7. Enhancing Reproducibility and Collaboration via Management of R Package Cohorts
    Gabriel Becker, Genentech Research; Cory Barr, Anticlockwork Arts; Robert Gentleman, Genentech Research; Michael Lawrence, Genentech Research
  8. GMM Versus GQL Logistic Regression Models for Multi-Level Correlated Data
    Bei Wang, Arizona State University; Jeffrey Wilson, W. P. Carey School of Business/Arizona State University
  9. Increasing the Accuracy of Gene Expression Classifiers by Incorporating Pathway Information: A Latent Group Selection Approach
    Yaohui Zeng, The University of Iowa; Patrick Breheny, The University of Iowa
  10. Learning staistics with R, from the Ground Up Xiaofei Wang
  11. Mining an R Bug Database with R
    Stephen Kaluzny, TIBCO Software Inc.
  12. Multinomial Regression for Correlated Data Using the Bootstrap in R
    Jennifer Thompson, Vanderbilt University; Timothy Girard, Vanderbilt University Medical Center; Pratik Pandharipande, Vanderbilt University Medical Center; E. Wesley Ely, Vanderbilt University Medical Center; Rameela Chandrasekhar, Vanderbilt University
  13. The Network Structure of R Packages
    Andrie de Vries, Revolution Analytics Limited; Joseph Rickert
  14. Online PCA in High Dimension: A Comparative Study
    David Degras, DePaul University; Hervé Cardot, Université de Bourgogne
  15. Perils and Solutions for Comparative Effectiveness Research in Massive Observational Databases
    Marc A. Suchard, UCLA
  16. R Package PRIMsrc: Bump Hunting by Patient Rule Induction Method for Survival, Regression, and Classification 
    Jean-Eudes Dazard, Case Western Reserve University; Michael Choe, Case Western Reserve University; Michael LeBlanc, Fred Hutchinson Cancer Research Center; J. Sunil Rao, University of Miami
  17. An R Package That Collects and Archives Files and Other Details to Support Reproducible Computing
    Stan Pounds, St. Jude Children's Research Hospital; Zhifa Liu, St. Jude Children's Research Hospital
  18. SimcAusal R Package: Conducting Transparent and Reproducible Simulation Studies of Causal Effect Estimation with Complex Longitudinal Data
    Oleg Sofrygin, Kaiser Permanente Northern California/UC Berkeley; Mark Johannes van der Laan, UC Berkeley; Romain Neugebauer, Kaiser Permanente Northern California Statistical Computation Using Student Collaborative Work John D. Emerson, Middlebury College
  19. Teaching Introductory Regression with R Using Package Regclass
    Adam Petrie
  20. Using Software to Search for Optimal Cross-Over Designs
    Byron Jones


To leave a comment for the author, please follow the link and comment on his blog: Revolutions.

R-bloggers.com offers daily e-mail updates about R news and tutorials on topics such as: visualization (ggplot2, Boxplots, maps, animation), programming (RStudio, Sweave, LaTeX, SQL, Eclipse, git, hadoop, Web Scraping) statistics (regression, PCA, time series, trading) and more...
5 New R Packages for Data Scientists

$
0
0

(This article was first published on Revolutions, and kindly contributed to R-bloggers)

by Joseph Rickert


One great beauty of the R ecosystem, and perhaps the primary reason for R’s phenomenal growth, is the system for contributing new packages. This, coupled to the rock solid stability of CRAN, R’s primary package repository, gives R a great advantage. However, anyone with enough technical knowhow to formulate a proper submission can contribute a package to CRAN. Cran_networkJust being on CRAN is no great indicator of merit: a fact that newcomers to R, and open source, often find troubling. It takes some time and effort working with R in a disciplined way to appreciate how the organic metracracy of the package system leads to high quality, integrated software. Nevertheless, even for relative newcomers it is not difficult to discover the bedrock packages that support the growth of the R language. Those packages that reliably add value to the R language and they are readily apparent in plots of CRAN’s package dependency network.


Finding new packages that may ultimately prove to be useful is another matter. In the spirit of discovery; here are 5, relatively new packages that I think may ultimately prove to be interesting to data scientists. None of these have been on CRAN long enough to be battle tested. So please, explore them with cooperation in mind.


AzureML V0.1.1

Cloud computing is, or will be, important to every practicing data scientist. Microsoft’s Azure ML is a particularly rich machine learning environment for R (and Python) programmers. If your are not yet an Azure user this new package goes a long way to overcoming the inertia involved in getting started. It provides functions to push R code from your local environment up to the Azure cloud and publish functions and models as web services. The vignette walks you step by step from getting a trial account and the necessary credentials to publishing your first simple examples.


distcomp V0.25.1

Distributed computing with large data sets is always tricky, especially in environments where it is difficult or impossible to share data among collaborators. A clever partial likelihood algorithm implemented in the distcomp package (See the paper by Narasimham et al.) makes it possible to build sophisticated statistical models on unaggregated data sets. Have a look at this previous blog post for more detail.


rotationForest V0.1

The forests algorithm is the “go to” ensemble method for many data scientists as it consistently performs well on diverse data sets. This new variation based on performing Principal Component Analysis on random subsets of the feature space shows great promise. See the paper by Rodriguez et. al. for an explanation of how the PCA amounts to rotating the feature space and a comparison of the rotation forest algorithm with standard random forests and the Adaboost algorithm.


rpca V0.2.3

Given a matrix that is a superposition of a low rank component and a sparse component, rcpa uses a robust PCA method to recover these components.  Netflix data scientists publicized this algorithm, which is based on a paper by Candes et al,  Robust Principal Component Analysis, earlier this year when they reported spectacular success using robust PCA in an outlier detection problem.

Netflix_outliers


SwarmSVM V0.1

The support vector machine is also a mainstay machine learning algorithm. SwarmSVM, which is based on a clustering approach as described in a  paper by Gu and Han provides three ensemble methods for training support vector machines. The vignette that accompanies the package provides a practical introduction to the method.


To leave a comment for the author, please follow the link and comment on his blog: Revolutions.

R-bloggers.com offers daily e-mail updates about R news and tutorials on topics such as: visualization (ggplot2, Boxplots, maps, animation), programming (RStudio, Sweave, LaTeX, SQL, Eclipse, git, hadoop, Web Scraping) statistics (regression, PCA, time series, trading) and more...
Modern Honey Network Machinations with R, Python, phantomjs, HTML & JavaScript

$
0
0

(This article was first published on Data Driven Security, and kindly contributed to R-bloggers)

This was (initially) going to be a blog post announcing the new mhn R package (more on what that is in a bit) but somewhere along the way we ended up taking a left turn at Albuquerque (as we often do here at ddsec hq) and had an adventure in a twisty maze of Modern Honey Network passages that we thought we’d relate to everyone.

Episode 0 : The Quest!

We find our intrepid heroes data scientists finally getting around to playing with the Modern Honey Network (MHN) software that they promised Jason Trost they’d do ages ago. MHN makes it easy to [freely] centrally setup, control, monitor and collect data from one or more honeypots. Once you have this data you can generate threat indicator feeds from it and also do analysis on it (which is what we’re interested in eventually doing and what ThreatStream does do with their global network of MHN contributors).

Jason has a Vagrant quickstart version of MHN which lets you kick the tyres locally, safely and securely before venturing out into the enterprise (or internet). You stand up the server (mostly Python-y things), then tell it what type of honeypot you want to deploy. You get a handy cut-and-paste-able string which you paste-and-execute on a system that will become an actual honeypot (which can be a “real” box, a VM or even a RaspberryPi!). When the honeypot is finished installing the necessary components it registers with your MHN server and you’re ready to start catching cyber bad guys.


(cyber bad guy)

Episode 1 : Live! R! Package!

We decided to deploy a test MHN server and series of honeypots on Digital Ocean since they work OK on the smallest droplet size (not recommended for a production MHN setup).

While it’s great to peruse the incoming attacks:

we wanted programmatic access to the data, so we took a look at all the routes in their API and threw together an R package to let us work with it.

library(mhn)

attacks <- sessions(hours_ago=24)$data
tail(attacks)

##                           _id destination_ip destination_port honeypot
## 3325 55d93cb8b5b9843e9bb34c75 111.222.33.111               22      p0f
## 3326 55d93cb8b5b9843e9bb34c74 111.222.33.111               22      p0f
## 3327 55d93d30b5b9843e9bb34c77 111.222.33.111               22      p0f
## 3328 55d93da9b5b9843e9bb34c79           <NA>             6379  dionaea
## 3329 55d93f1db5b9843e9bb34c7b           <NA>             9200  dionaea
## 3330 55d94062b5b9843e9bb34c7d           <NA>               23  dionaea
##                                identifier protocol       source_ip source_port
## 3325 bf7a3c5e-48e7-11e5-9fcf-040166a73101     pcap    45.114.11.23       58621
## 3326 bf7a3c5e-48e7-11e5-9fcf-040166a73101     pcap    45.114.11.23       58621
## 3327 bf7a3c5e-48e7-11e5-9fcf-040166a73101     pcap    93.174.95.81       44784
## 3328 83e2f4e0-4876-11e5-9fcf-040166a73101     pcap 184.105.139.108       43000
## 3329 83e2f4e0-4876-11e5-9fcf-040166a73101     pcap  222.186.34.160        6000
## 3330 83e2f4e0-4876-11e5-9fcf-040166a73101     pcap   113.89.184.24       44028
##                       timestamp
## 3325 2015-08-23T03:23:34.671000
## 3326 2015-08-23T03:23:34.681000
## 3327 2015-08-23T03:25:33.975000
## 3328 2015-08-23T03:27:36.810000
## 3329 2015-08-23T03:33:48.665000
## 3330 2015-08-23T03:39:13.899000

NOTE: that’s not the real destination_ip so don’t go poking since it’s probably someone else’s real system (if it’s even up).

You can also get details about the attackers (this is just one example):

attacker_stats("45.114.11.23")$data

## $count
## [1] 1861
## 
## $first_seen
## [1] "2015-08-22T16:43:59.654000"
## 
## $honeypots
## [1] "p0f"
## 
## $last_seen
## [1] "2015-08-23T03:23:34.681000"
## 
## $num_sensors
## [1] 1
## 
## $ports
## [1] 22

The package makes it really easy (OK, we’re probably a bit biased) to grab giant chunks of time series and associated metadata for further analysis.

While cranking out the API package we noticed that there were no endpoints for the MHN HoneyMap. Yes, they do the “attacks on a map” thing but don’t think too badly of them since most of you seem to want them.

After poking around the MHN source a bit more (and navigating the view-source of the map page) we discovered that they use a Go-based websocket server to push the honeypot hits out to the map. (You can probably see where this is going, but it takes that turn first).

Episode 2 : Hacking the Anti-Hackers

The other thing we noticed is that—unlike the MHN-server proper—the websocket component does not require authentication. Now, to be fair, it’s also not really spitting out seekrit data, just (pretty useless) geocoded attack source/dest and type of honeypot involved.

Still, this got us wondering if we could find other MHN servers out there in the cold, dark internet. So, we fired up RStudio again and took a look using the shodan package:

library(shodan)

# the most obvious way to look for MHN servers is to 
# scour port 3000 looking for content that is HTML
# then look for "HoneyMap" in the <title>

# See how many (if any) there are
host_count('port:3000 title:HoneyMap')$total
## [1] 141

# Grab the first 100
hm_1 <- shodan_search('port:3000 title:HoneyMap')

# Grab the last 41
hm_2 <- shodan_search('port:3000 title:HoneyMap', page=2)

head(hm_1)

##                                           hostnames    title
## 1                                                   HoneyMap
## 2                                  hb.c2hosting.com HoneyMap
## 3                                                   HoneyMap
## 4                                          fxxx.you HoneyMap
## 5            ip-192-169-234-171.ip.secureserver.net HoneyMap
## 6 ec2-54-148-80-241.us-west-2.compute.amazonaws.com HoneyMap
##                    timestamp                isp transport
## 1 2015-08-22T17:14:25.173291               <NA>       tcp
## 2 2015-08-22T17:00:12.872171 Hosting Consulting       tcp
## 3 2015-08-22T16:49:40.392523      Digital Ocean       tcp
## 4 2015-08-22T15:27:29.661104      KW Datacenter       tcp
## 5 2015-08-22T14:01:21.014893   GoDaddy.com, LLC       tcp
## 6 2015-08-22T12:01:52.207879             Amazon       tcp
##                                                                                                                                                                                                       data
## 1 HTTP/1.1 200 OKrnAccept-Ranges: bytesrnContent-Length: 2278rnContent-Type: text/html; charset=utf-8rnLast-Modified: Sun, 02 Nov 2014 21:16:17 GMTrnDate: Sat, 22 Aug 2015 17:14:22 GMTrnrn
## 2 HTTP/1.1 200 OKrnAccept-Ranges: bytesrnContent-Length: 2278rnContent-Type: text/html; charset=utf-8rnLast-Modified: Wed, 12 Nov 2014 18:52:21 GMTrnDate: Sat, 22 Aug 2015 17:01:25 GMTrnrn
## 3 HTTP/1.1 200 OKrnAccept-Ranges: bytesrnContent-Length: 2278rnContent-Type: text/html; charset=utf-8rnLast-Modified: Mon, 04 Aug 2014 18:07:00 GMTrnDate: Sat, 22 Aug 2015 16:49:38 GMTrnrn
## 4 HTTP/1.1 200 OKrnAccept-Ranges: bytesrnContent-Length: 2278rnContent-Type: text/html; charset=utf-8rnDate: Sat, 22 Aug 2015 15:22:23 GMTrnLast-Modified: Sun, 27 Jul 2014 01:04:41 GMTrnrn
## 5 HTTP/1.1 200 OKrnAccept-Ranges: bytesrnContent-Length: 2278rnContent-Type: text/html; charset=utf-8rnLast-Modified: Wed, 29 Oct 2014 17:12:22 GMTrnDate: Sat, 22 Aug 2015 14:01:20 GMTrnrn
## 6 HTTP/1.1 200 OKrnAccept-Ranges: bytesrnContent-Length: 1572rnContent-Type: text/html; charset=utf-8rnDate: Sat, 22 Aug 2015 12:06:15 GMTrnLast-Modified: Mon, 08 Dec 2014 21:25:26 GMTrnrn
##   port location.city location.region_code location.area_code location.longitude
## 1 3000          <NA>                 <NA>                 NA                 NA
## 2 3000   Miami Beach                   FL                305           -80.1300
## 3 3000 San Francisco                   CA                415          -122.3826
## 4 3000     Kitchener                   ON                 NA           -80.4800
## 5 3000    Scottsdale                   AZ                480          -111.8906
## 6 3000      Boardman                   OR                541          -119.5290
##   location.country_code3 location.latitude location.postal_code location.dma_code
## 1                   <NA>                NA                 <NA>                NA
## 2                    USA           25.7906                33109               528
## 3                    USA           37.7312                94124               807
## 4                    CAN           43.4236                  N2E                NA
## 5                    USA           33.6119                85260               753
## 6                    USA           45.7788                97818               810
##   location.country_code location.country_name                           ipv6
## 1                  <NA>                  <NA> 2600:3c02::f03c:91ff:fe73:4d8b
## 2                    US         United States                           <NA>
## 3                    US         United States                           <NA>
## 4                    CA                Canada                           <NA>
## 5                    US         United States                           <NA>
## 6                    US         United States                           <NA>
##            domains                org   os module                         ip_str
## 1                                <NA> <NA>   http 2600:3c02::f03c:91ff:fe73:4d8b
## 2    c2hosting.com Hosting Consulting <NA>   http                  199.88.60.245
## 3                       Digital Ocean <NA>   http                104.131.142.171
## 4         fxxx.you      KW Datacenter <NA>   http                  162.244.29.65
## 5 secureserver.net   GoDaddy.com, LLC <NA>   http                192.169.234.171
## 6    amazonaws.com             Amazon <NA>   http                  54.148.80.241
##           ip     asn link uptime
## 1         NA    <NA> <NA>     NA
## 2 3344448757 AS40539 <NA>     NA
## 3 1753452203    <NA> <NA>     NA
## 4 2733907265    <NA> <NA>     NA
## 5 3232361131 AS26496 <NA>     NA
## 6  915689713    <NA> <NA>     NA

Yikes! 141 servers just on the default port (3000) alone! While these systems may be shown as existing in Shodan, we really needed to confirm that they were, indeed, live MHN HoneyMap [websocket] servers.

Episode 3 : Picture [Im]Perfect

Rather than just test for existence of the websocket/data feed we decided to take a screen shot of every server, which is pretty easy to do with a crude-but-effective mashup of R and phantomjs. For this, we made a script which is just a call—for each of the websocket URLs—to the “built-in” phantomjs rasterize.js script that we’ve slightly modified to wait 30 seconds from page open to snapshot creation. We did that in the hopes that we’d see live attacks in the captures.

cat(sprintf("phantomjs rasterize.js http://%s:%s %s.png 800px*600pxn",
            hm_1$matches$ip_str,
            hm_1$matches$port,
            hm_1$matches$ip_str), file="capture.sh")

That makes capture.sh look something like:

phantomjs rasterize.js http://199.88.60.245:3000 199.88.60.245.png 800px*600px
phantomjs rasterize.js http://104.131.142.171:3000 104.131.142.171.png 800px*600px
phantomjs rasterize.js http://162.244.29.65:3000 162.244.29.65.png 800px*600px
phantomjs rasterize.js http://192.169.234.171:3000 192.169.234.171.png 800px*600px
phantomjs rasterize.js http://54.148.80.241:3000 54.148.80.241.png 800px*600px
phantomjs rasterize.js http://95.97.211.86:3000 95.97.211.86.png 800px*600px

Yes, there are far more elegant ways to do this, but the number of URLs was small and we had no time constraints. We could have used a
pure phantomjs solution (list of URLs in phantomjs JavaScript) or used
GNU parallel to speed up the image captures as well.

Sifting through ~140 images manually to see if any had “hits” would not have been too bad, bit a glance at the directory listing showed that many had the exact same size, meaning those were probably showing a default/blank map. We uniq‘d them by MD5 hash and made an image gallery of them:

It was interesting to see Mexico CERT and OpenDNS in the mix.

Most of the 141 were active/live MHN HoneyMap sites. We can only imagine what a full Shodan search for HoneyMaps on other ports would come back with (mostly since we only have the basic API access and don’t want to burn the credits).

Episode 3 : With “Meh” Data Comes Great Irresponsibility

For those who may not have been with DDSec for it’s entirety, you may not be aware that we have our own attack map (github).

We thought it would be interesting to see if we could mashup MHN HoneyMap data with our creation. We first had to see what the websocket returned. Here’s a bit of Python to do that (the R websockets package was abandoned by it’s creator, but keep an eye out for another @hrbrmstr resurrection):

import websocket
import thread
import time

def on_message(ws, message):
    print message

def on_error(ws, error):
    print error

def on_close(ws):
    print "### closed ###"


websocket.enableTrace(True)
ws = websocket.WebSocketApp("ws://128.199.121.95:3000/data/websocket",
                            on_message = on_message,
                            on_error = on_error,
                            on_close = on_close)
ws.run_forever()

That particular server is very active, hence why we chose to use it.

The output should look something like:

$ python ws.py
--- request header ---
GET /data/websocket HTTP/1.1
Upgrade: websocket
Connection: Upgrade
Host: 128.199.121.95:3000
Origin: http://128.199.121.95:3000
Sec-WebSocket-Key: 07EFbUtTS4ubl2mmHS1ntQ==
Sec-WebSocket-Version: 13


-----------------------
--- response header ---
HTTP/1.1 101 Switching Protocols
Upgrade: websocket
Connection: Upgrade
Sec-WebSocket-Accept: nvTKSyCh+k1Rl5HzxkVNAZjZZUA=
-----------------------
{"city":"Clarks Summit","city2":"San Francisco","countrycode":"US","countrycode2":"US","latitude":41.44860076904297,"latitude2":37.774898529052734,"longitude":-75.72799682617188,"longitude2":-122.41940307617188,"type":"p0f.events"}
{"city":null,"city2":"Singapore","countrycode":"US","countrycode2":"SG","latitude":32.78310012817383,"latitude2":1.2930999994277954,"longitude":-96.80670166015625,"longitude2":103.85579681396484,"type":"p0f.events"}

Those are near-perfect JSON records for our map, so we figured out a way to tell iPew/PewPew (whatever folks are calling it these days) to take any accessible MHN HoneyMap as a live data source. For example, to plug this highly active HoneyMap into iPew all you need to do is this:

http://ocularwarfare.com/ipew/?mhnsource=http://128.199.121.95:3000/data/

Once we make the websockets component of the iPew map a bit more resilient we’ll post it to GitHub (you can just view the source to try it on your own now).

Fin

As we stated up front, the main goal of this post is to introduce the mhn package. But, our diversion has us curious. Are the open instances of HoneyMap deliberate or accidental? If any of them are “real” honeypot research or actual production environments, does such an open presence of the MHN controller reduce the utility of the honeypot nodes? Is Greenland paying ThreatStream to use that map projection instead of a better one?

If you use the new package, found this post helpful (or, at least, amusing) or know the answers to any of those questions, drop a note in the comments.

To leave a comment for the author, please follow the link and comment on his blog: Data Driven Security.

R-bloggers.com offers daily e-mail updates about R news and tutorials on topics such as: visualization (ggplot2, Boxplots, maps, animation), programming (RStudio, Sweave, LaTeX, SQL, Eclipse, git, hadoop, Web Scraping) statistics (regression, PCA, time series, trading) and more...
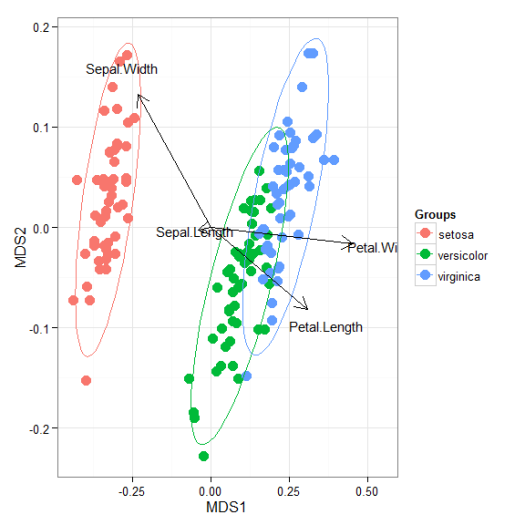
R in big data pipeline

$
0
0

(This article was first published on Opiate for the masses, and kindly contributed to R-bloggers)

R is my fabovite tool for research. There are still quite a few things that only R can do or quicker/easier with R.

But unfortunately a lot of people think R becomes less powerful at production stage where you really need to make sure all the functionalities run as you planned against incoming big data.

Personally, what makes R special in the data field is its ability to become friend with many other tools. R can easily ask JavaScript for data visualization, node.js for interactive web app and data pipeline tools/databases for production ready big data system.

In this post I address how to use R stably combined with other tools in big data pipeline without losing its awesomeness.

tl;dr

You’ll find how to include R into luigi, light weight python data workflow management library. You can still use R’s awesomeness in complex big data pipeline while handling big data tasks by other appropriate tools.

I’m not covering luigi basics in this post. Please refer to luigi website if necesary.

Simple pipeline

Here is a very simple example;

  • HiveTask1: Wait for external hive data task (table named “externaljob” partitioned by timestamp)

  • RTask: Run awesome R code as soon as pre-aggregation finishes

  • HiveTask2: Upload it back to Hive as soon as the above job finishes (table names “awesome” partitioned by timestamp)

and you wanna do this job everyday in an easily debuggable fashion with fancy workflow UI.

That’s super easy, just run


python awesome.py --HiveTask1-timestamp 2015-08-20

This runs python file called awesome.py. --HiveTask1-timestamp 2015-08-20 sets 2015-08-20 as timestamp argument in HiveTask1 class.

Yay, all the above tasks are now connected in the luigi task UI!
Notice our workflow goes from bottom to top.
You can see there is an error in the very first HiveTask2 but this is just by design.

luigi-workflow

Codes

Let’s take a look at awesome.py:

import luigi
from luigi.file import LocalTarget
from luigi.hive import HiveTableTarget
from luigi.contrib.hdfs import HdfsTarget
import subprocess
import sys

class HiveTask1(luigi.ExternalTask):
    timestamp = luigi.DateParameter(is_global=True)
    def output(self):
        return HdfsTarget('/user/storage/externaljob/timestamp=%s' % self.timestamp.strftime('%Y%m%d'))

class RTask(luigi.Task):
    timestamp = HiveTask1.timestamp
    def requires(self):
        return HiveTask1()
    def run(self):
        subprocess.call('Rscript awesome.R %s' % self.timestamp.strftime('%Y%m%d'),shell=True)
    def output(self):
        return LocalTarget('awesome_is_here_%s.txt' % self.timestamp.strftime('%Y%m%d'))

class HiveTask2(luigi.Task):
    timestamp=HiveTask1.timestamp
    def requires(self):
        return RTask()
    def run(self):
        subprocess.call('Rscript update2hive.R %s' % self.timestamp.strftime('%Y%m%d'),shell=True)
    def output(self):
        return HdfsTarget('/user/hive/warehouse/awesome/timestamp=%s' % self.timestamp.strftime('%Y%m%d'))


if __name__ == '__main__':
    luigi.run()

Basically the file only contains three classes (HiveTask1, RTask and HiveTask2) and their dependency is specified by

def requires(self):
        return TASKNAME

luigi checks dependencies and outputs of each step so it checks existense of;

  • '/user/storage/externaljob/timestamp=%s' % self.timestamp.strftime('%Y%m%d')
  • 'awesome_is_here_%s.txt' % self.timestamp.strftime('%Y%m%d')
  • '/user/hive/warehouse/awesome/timestamp=%s' % self.timestamp.strftime('%Y%m%d')

The most important thing here is using python’s subprocess module with shell=True, so you can run your R file

def run(self):
        subprocess.call('Rscript YOUR_R_FILE',shell=True)

The timestamp argument you gave at the very beginning is stored as global variable timestamp (well, this is not necessarily the coolest option)

timestamp = luigi.DateParameter(is_global=True)

and can be used in other tasks by

timestamp = HiveTask1.timestamp

Moreover, you can pass timestamp to R file by

'Rscript awesome.R %s' % self.timestamp.strftime('%Y%m%d')

Then let’s take a look at awesome.R

library(infuser)
args <- commandArgs(TRUE)
X <- as.character(args[1])
timestamp <- format(as.Date(X,"%Y-%m-%d"),"%Y%m%d")

DO AWESOME THINGS

write.csv(YOUREAWESOME,file=paste0('awesome_is_here_',timestamp,'.txt'),row.names=F)

In R side, you can receive timestamp argument you passed from python by

args <- commandArgs(TRUE)
X <- as.character(args[1])

Similarly, update2hive.R can look like

library(infuser)
args <- commandArgs(TRUE)
X <- as.character(args[1])
temp <- list.files(pattern='TEMPLATE.hql')
Q <- infuse(temp, timestamp=timestamp,verbose=T)
fileConn<-file("FINALHQL.hql")
writeLines(Q, fileConn)
close(fileConn)
system('hive -f FINALHQL.hql')
#this file updates

One last thing you might like to do is to set a cronjob.


0 1 * * * python awesome.py --HiveTask1-timestamp `date --date='+1 days' +%Y-%m-%d`

This one for example runs the whole thing at 1 a.m everyday.

Conclusion

In this post I’ve shown simple example of how to quickly convert your research R project into solid deployable product.
This is not limited to simple R-hive integration but you can let R, spark, databases, stan/bugs, H2O, vowpal wabbit and millions of other data tools dance together as you wish. and you’ll recognize R still plays a central role in the play.

Codes

The full codes are available from here.

R in big data pipeline was originally published by Kirill Pomogajko at Opiate for the masses on August 16, 2015.

To leave a comment for the author, please follow the link and comment on his blog: Opiate for the masses.

R-bloggers.com offers daily e-mail updates about R news and tutorials on topics such as: visualization (ggplot2, Boxplots, maps, animation), programming (RStudio, Sweave, LaTeX, SQL, Eclipse, git, hadoop, Web Scraping) statistics (regression, PCA, time series, trading) and more...
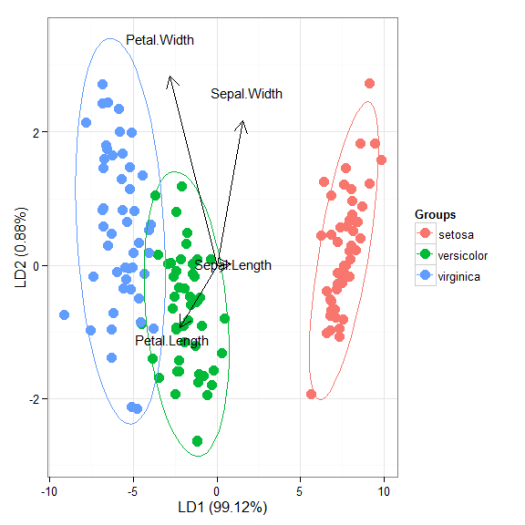
Ofuro, start H2O on Hadoop from R

$
0
0

(This article was first published on Opiate for the masses, and kindly contributed to R-bloggers)

tl;dr

I made a simple functionality to start H2O on hadoop from R.
You can easily start H2O on hadoop, run your analytics and close all the processes without occuppying Hadoop nodes and memory all the time.


I like to take a bath. Fill a bath and warm up in there is a perfect refreshment after a hard working day. I like it so much so I decided to do it even at work. I’m running H2O in the huge bathtub called hadoop. I’m lazy to do any hadoop side setting (and don’t wanna bother my super data engineer team), but I wanted to have a button that starts and finishes everything from R. Now I have it and name it ofuro, bathing in Japanese, which starts H2O on hadoop from R and finishes it after your awesome works.

ofuro

H2O

H2O is a big data machine learning platform. H2O can easily cook big data that R or Python can’t and provides many machine learning solutions like neural network, GBM and random forest. There is a standalone version and an on-hadoop one if you like to crunch hundreds of gigabytes. And this is easily controlable from R or Python through an API.

The download is super easy. Get the right one for your system from here and follow the instructions.

Starting H2O

Starting H2O standalone version is just one line.
h2o.init()

But starting it on hadoop is a bit tricky and currently there doesn’t seem to be a one click solution.
In my case, presumably the same for many data scientists, hadoop is a shared asset at work and it’s not cool to keep it running and occupy nodes.
But no worries, the snippet below is everything you need!

Ofuro

system("
  cd YOUR_H2O_DIRECTORY/h2o-3.1.0.3098-cdh5.4.2 # Your H2O version should be different
  hadoop jar h2odriver.jar -output h2o -timeout 6000 > YOUR_WORKING_DIR/h2o_msg.txt
",wait=F) 

#timeout: timeout duration. See here for more H2O parameters

h2o_ip <- NA; h2o_port <- NA
while(is.na(h2o_ip)&is.na(h2o_port)){
f <- tryCatch(read.table('h2o_msg.txt',header=F,sep='n'),error = function(c) data.table(NA))
firstNode <- as.character(f[grep('H2O node',f$V1),][1])
firstNodeSplit <- strsplit(firstNode,' ')[[1]][3]
h2o_ip <- strsplit(firstNodeSplit,':')[[1]][1]
h2o_port <- as.numeric(strsplit(firstNodeSplit,':')[[1]][2])
}
h2o = h2o.init(ip=h2o_ip,port=h2o_port,startH2O=F)

YOUR_AWESOME_H2O_JOBS

applicationNo <- strsplit(as.character(f[grep('application_',f$V1),]),' ')[[1]][10]
system(paste0('yarn application -kill ',applicationNo))
system('hadoop fs -rm -r h2o')
system('rm YOUR_WORKING_DIR/h2o_msg.txt')

This is basically three-parter codes.

Chunk 1

system("
cd YOUR_H2O_DIRECTORY/h2o-3.1.0.3098-cdh5.4.2 # Your H2O version should be different
hadoop jar h2odriver.jar -output h2o -timeout 6000 > YOUR_WORKING_DIR/h2o_msg.txt
",wait=F) 
#timeout: timeout duration. See here for more H2O parameters

This just goes to your H2O folder and starts H2O server on hadoop.
Make sure to change YOUR_H2O_DIRECTORY,h2o-3.1.0.3098-cdh5.4.2 and YOUR_WORKING_DIR to appropriate ones.

system('COMMAND_LINE_CODE',wait=F) runs your COMMAND_LINE_CODE without waiting for the results. So you can basically do something else before your bath is ready.
All the server log is stored in YOUR_WORKING_DIR/h2o_msg.txt

My h2o_msg.txt looks like this (and yours should look different)

Determining driver host interface for mapper->driver callback…
[Possible callback IP address: 148.251.41.166]
[Possible callback IP address: 127.0.0.1]
Using mapper->driver callback IP address and port: 148.251.41.166:26129
(You can override these with -driverif and -driverport.)
Memory Settings:
mapreduce.map.java.opts: -Xms60g -Xmx60g -Dlog4j.defaultInitOverride=true
Extra memory percent: 10
mapreduce.map.memory.mb: 67584
Job name ‘H2O_10763’ submitted
JobTracker job ID is ‘job_1439400060928_7854’
For YARN users, logs command is ‘yarn logs -applicationId application_1439400060928_7854’
Waiting for H2O cluster to come up…
H2O node 172.22.60.96:54321 requested flatfile
H2O node 172.22.60.93:54321 requested flatfile
H2O node 172.22.60.92:54321 requested flatfile
H2O node 172.22.60.94:54321 requested flatfile
Sending flatfiles to nodes…
[Sending flatfile to node 172.22.60.96:54321]
[Sending flatfile to node 172.22.60.93:54321]
[Sending flatfile to node 172.22.60.92:54321]
[Sending flatfile to node 172.22.60.94:54321]
H2O node 172.22.60.96:54321 reports H2O cluster size 1
H2O node 172.22.60.94:54321 reports H2O cluster size 1
H2O node 172.22.60.93:54321 reports H2O cluster size 1
H2O node 172.22.60.92:54321 reports H2O cluster size 1
H2O node 172.22.60.94:54321 reports H2O cluster size 4
H2O node 172.22.60.96:54321 reports H2O cluster size 4
H2O node 172.22.60.92:54321 reports H2O cluster size 4
H2O node 172.22.60.93:54321 reports H2O cluster size 4
H2O cluster (4 nodes) is up
(Note: Use the -disown option to exit the driver after cluster formation)
Open H2O Flow in your web browser: http://172.22.60.93:54321
(Press Ctrl-C to kill the cluster)
Blocking until the H2O cluster shuts down…

Chunk 2

h2o_ip <- NA; h2o_port <- NA
while(is.na(h2o_ip)&is.na(h2o_port)){
f <- tryCatch(read.table('h2o_msg.txt',header=F,sep='n'),error = function(c) data.table(NA))
firstNode <- as.character(f[grep('H2O node',f$V1),][1])
firstNodeSplit <- strsplit(firstNode,' ')[[1]][3]
h2o_ip <- strsplit(firstNodeSplit,':')[[1]][1]
h2o_port <- as.numeric(strsplit(firstNodeSplit,':')[[1]][2])
}
h2o = h2o.init(ip=h2o_ip,port=h2o_port,startH2O=F)

Chunk 2 iterates a while loop till it reaches the first H2O node and get its IP and port.
This captures the very first one of randomly allocated IPs and ports so R knows where to connect.

Chunk 3

applicationNo <- strsplit(as.character(f[grep('application_',f$V1),]),' ')[[1]][10]
system(paste0('yarn application -kill ',applicationNo))
system('hadoop fs -rm -r h2o')
system('rm YOUR_WORKING_DIR/h2o_msg.txt')

Chunk 3 does let the water out of your bath and clean it.
yarn application -kill may vary depending on your system.
This also deletes h2o hdfs derectory and h2o_msg.txt for the next time.

Codes

The full codes are available from here

Ofuro, start H2O on Hadoop from R was originally published by Kirill Pomogajko at Opiate for the masses on August 22, 2015.

To leave a comment for the author, please follow the link and comment on his blog: Opiate for the masses.

R-bloggers.com offers daily e-mail updates about R news and tutorials on topics such as: visualization (ggplot2, Boxplots, maps, animation), programming (RStudio, Sweave, LaTeX, SQL, Eclipse, git, hadoop, Web Scraping) statistics (regression, PCA, time series, trading) and more...
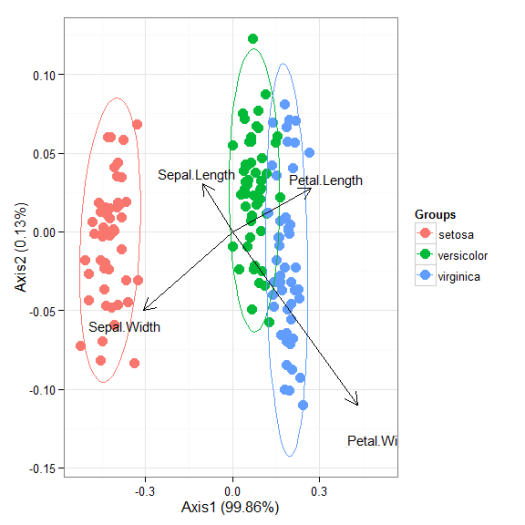
Why I Don’t Like Jupyter (FKA IPython Notebook)

$
0
0

(This article was first published on Opiate for the masses, and kindly contributed to R-bloggers)

Don’t get me wrong, it’s certainly a great tool for presenting your code or even reporting, but everytime I use it for explorative, interactive data science, I keep switching to other tools quite quickly and wonder why I am still even trying to use it. I just mostly end up with messy, broken, “ungitable” and unreadable analyses and I refuse to accept that this is my fault, but rather believe it is caused by the design of Jupyter/IPython.

It messes with your version control.

The Jupyter Notebook format is just a big json, which contains your code and the outputs of the code. Thus version control is difficult, because every time you make minimal changes to the code or rerun it with updated data, you will have to commit the code and all new results or outputs of it. This will unnecessarily blow up your repos used disk memory and make the diffs difficult to read (which would give a whole new meaning to the abbreviation diff). Yeah, I know, you also can export your code to a script (in my case .R script with the code), but then, why the overhead of using the code in two formats?

Code can only be run in chunks.

In Jupyter you can not run the code line by line. This means for testing or experimenting with your code or data, you either split your Notebook in one-liner chunks, which looks awful, or you make sure, that the lines you want to test are in a chunk, which has no lines, that take long to compute thing, you don’t actually want to.

It’s difficult to keep track

If you don’t work your way down the notebook, but also work wih chunks in between other chunks, because you are still playing with the code, reviewing it or adapting it to new circumstances, you end up with a notebook, which has newer results above the older results. So to make sure you know the order or up-to-dateness of your results, you will have to check the execution numbers and can’t rely on the order of the output anymore.

Code often ends up very fragmented

This is a logical consequence of my previous two points. People start splitting the chunks and forget to put them back together, lose track of the order of the analysis and it all ends up in a big mess. Good luck exporting it to .R or another native format, because then you will often find bugs, due to outdated code, wrong order, missing variables …

The output is incomplete

This is maybe R specific, but I made an experience that the output is incomplete. Especially if you work with ggplot. Some warning messages don’t appear in the notebook, but in the terminal, you started the notebook from. This is annoying, because actually that means that you should check your terminal and your output after every command you run to make sure not to miss warnings and error messages.

Potential security risks?

I ain’t no security specialist, but the notebook opens a http port. Pray to lord it will not land on 0.0.0.0 port. In that case the whole universe has access to your notebook and thus to your system. I think I should write a crawler which checks for open Jupyter ports on random machines. That will teach you a lesson.

Limitation

Good luck writing shiny applications, or neat Rmarkdown presentations/websites/reports.


This points are only the ones from the top of my head and I somehow have the feeling, that the list is not complete. What is your experience? I am excited about your comments.

Why I Don’t Like Jupyter (FKA IPython Notebook) was originally published by Kirill Pomogajko at Opiate for the masses on August 22, 2015.

To leave a comment for the author, please follow the link and comment on his blog: Opiate for the masses.

R-bloggers.com offers daily e-mail updates about R news and tutorials on topics such as: visualization (ggplot2, Boxplots, maps, animation), programming (RStudio, Sweave, LaTeX, SQL, Eclipse, git, hadoop, Web Scraping) statistics (regression, PCA, time series, trading) and more...
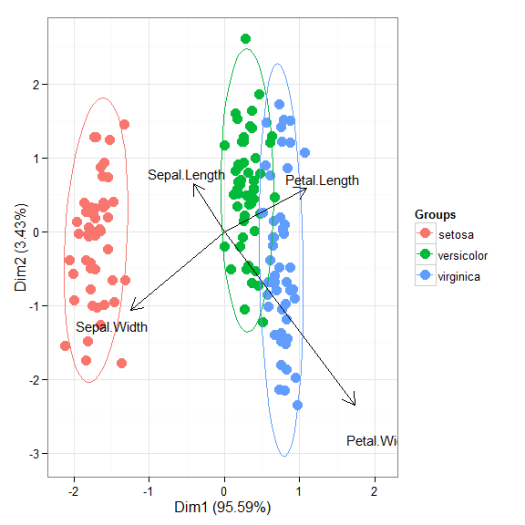
xkcd survey and the power to shape the internet

$
0
0

(This article was first published on Opiate for the masses, and kindly contributed to R-bloggers)

The xkcd survey

If you’ve never heard of xkcd, it’s “[a] webcomic of romance, sarcasm, math, and language” created by Randall Munroe. Also, if you’ve never heard of xkcd, be prepared for losing at least a day’s worth of productivity reading the comics and the excellent what if column where Randall answers hypothetical questions with physics.

Randall used his webcomic to post a survey, asking the internet to fill out a number of questions designed to generate “an interesting and unusual data set for people to play with”:

xkcd survey webcomic call to action

If you’re reading this, please head over to the survey and fill it out! Also, please send it to your friends and acquaintances who usually do not read these kind of blogs and webcomics – the more diverse the audience, the more interesting the resulting data set!

While the survey is still open, the resulting dataset is not available. But can we already do some nifty and fancy still with it? Yes we can!

The internet

The internet is a pretty big place. So big in fact, it’s pretty difficult for an individual to affect it. Granted, Michael Jackson crashed google upon his death. But most of us do not have his reach, and we’re all pretty much alive still.

A single person can have an impact on the internet as whole. Either you’re as famous as Michael, or you can bring your weight to bear on a particularly obscure and unknown part of the internet. In this case, your relative impact (and economists always talk in relative terms) is much higher.

Randall has a pretty large impact on the internet to start with (well, compared to me; not compared to Michael Jackson), but is it large enough to move even Google Search Trends, or in other words, to move the collective internet conciousness?

The first-look analysis

This is just a first look at the data, but I wanted to get this out as soon as possible, to convince more people to take part in the survey. Hopefully by seeing that you can indeed do interesting stuff with the survey – before the actual data has been released even! – more people will be convinced to give it a try.

Google Search Trends have been used by many, for instance for unemployment forecasting, to detect influenza epidemics, and to monitor suicide rates. The idea is always the same: if something has a large enough impact, it will shift the google search trends upwards.

In the xkcd survey, one question was if the reader knew the meaning of a number of obscure English words, such as “Regolith”, or “Slickle”. My hypothesis is that the interest in these words by people reading the survey will be piqued, and thus these readers will google for these words – leading to a tiny, tiny uplift in the search trends for the respective word. If Randall’s reach on the internet is large enough, we should be able to see a noticeable uplift in the search trends for these words.

The second hypothesis is that the relative impact on more obscure words is larger, so we should see a large uplift in more esoteric words. This is untested here, since I do not have a good idea of how to rank words by “obscureness”. If someone has a smart idea on this, please contact me, I’d be delighted!

I grabbed the search trends data on the xkcd survey words off the google search trends site as .csv files. The data is available on github along with the full code needed to process it. Reading the data is relatively straightforward, you just have to account for the fact that google only allows you to search for five keywords on the website (resulting in four csv files), and that the csv is filled with a lot information that you don’t need, so I just pull the relevant rows and merge them all into one dataset:

f.gtrend.csv.read <- function(x){
  read.csv(file=paste0("data/report_", sprintf("%02d", as.numeric(x)), ".csv"), 
           na.strings = " ", 
           stringsAsFactors = FALSE,
           # 173 is last timeseries row, minus skip, minus header = 168
           skip = 4, nrows = 168)
}

# merge all four google .csvs 
data.raw <- f.gtrend.csv.read(1) %>% 
  merge(f.gtrend.csv.read(2)) %>% 
  merge(f.gtrend.csv.read(3)) %>% 
  merge(f.gtrend.csv.read(4)) %>% 
  mutate(
    Time = as.POSIXct(strptime(Time, "%Y-%m-%d-%H:%M UTC", tz="UTC"))
  )

Now, with the data available in R, let’s graph this stuff!

# big pile of trend lines, starting September-01
data.raw %>% 
  gather(term, trend, -Time) %>% 
  ggplot()+
  geom_line(size=1)+
  aes(x=Time, y=trend, colour=term)+
  coord_cartesian(xlim = c(as.POSIXct(strptime("2015-09-01", "%Y-%m-%d", tz="UTC")),
                           max(data.raw$Time)))+
  ggtitle("Google Search Trends of the xkcd survey English Terms")

xkcd trending words, messy

Oof. A mess of lines. Let’s get that sorted out by plotting each search term individually:

# faceted for better overview
data.raw %>% 
  gather(term, trend, -Time) %>% 
  ggplot()+
  geom_line(size=1)+
  aes(x=Time, y=trend, colour=term)+
  coord_cartesian(xlim = c(as.POSIXct(strptime("2015-09-01", "%Y-%m-%d", tz="UTC")),
                           max(data.raw$Time)))+
  facet_wrap(~term)+
  guides(colour=FALSE)+
  theme(axis.text.x=element_text(angle = 45, hjust = 1))+
  ggtitle("Google Search Trends of the xkcd survey English Terms")

xkcd trending words, faceted

Much nicer. We can clearly see that some words (e.g. unitory, regolith, fination) show a clear uplift after the survey was posted (around noon UTC, September 2nd). Other words have a smaller impact (e.g. apricity, revergent, cadine), while others again have a minuscle to zero impact (e.g. rife, soliquy having a tiny impact, and hubris having zero).

Conclusion

Randall does have an impact on the search trends!

Taking a deeper look into which words have a higher impact will be interesting. Also, once the survey results have been posted, an obvious test would be check for interaction between the search impact and the share of people knowing the word in question. If more survey users know the word, there is no need for them to google it, and thus resulting in a smaller search trend impact.

Again, please share the survey and pester your friends to fill it in as well – for science!

Code and data for this analysis is availabe on github, of course.

xkcd survey and the power to shape the internet was originally published by Kirill Pomogajko at Opiate for the masses on September 03, 2015.

To leave a comment for the author, please follow the link and comment on his blog: Opiate for the masses.

R-bloggers.com offers daily e-mail updates about R news and tutorials on topics such as: visualization (ggplot2, Boxplots, maps, animation), programming (RStudio, Sweave, LaTeX, SQL, Eclipse, git, hadoop, Web Scraping) statistics (regression, PCA, time series, trading) and more...

In case you missed it: August 2015 roundup

$
0
0

(This article was first published on Revolutions, and kindly contributed to R-bloggers)

In case you missed them, here are some articles from August of particular interest to R users. 

Creating interactive time series charts of financial data in R.

Many R books have been translated into Chinese

A tutorial on visualizing current-events geographic data with choropleths.

Revolution R Enterprise 7.4.1 is now available on Windows and Linux servers and in the Azure Marketplace.

Zillow uses R to estimate the value of houses and rental properties.

There’s a new (and free) online course on edX for R beginners, sponsored by Microsoft and presented by DataCamp. 

Mini-reviews of 5 new R packages: AzureML, distcomp, rotationForest, rpca, and SwarmSVM.

The R Consortium’s best practices for secure use of R

How to extract data from a SQL Server database in Azure to an R client running Linux.

DeployR Open 7.4.1, the open-source server-based framework for simple and secure R integration for application developers, is now available.

R 3.2.2 is now available.

A review of the JSM 2015 conference and the prevalence of R there.

R is available with Cortana Analytics, which you can learn about in upcoming workshops and webinars.

A comparison of the network structure of the CRAN and Bioconductor repositories.

Using R to find signal in noisy data.

I discussed the R Consortium in the inaugural episode of the R Talk podcast.

An exponential random graph model of connections between CRAN packages.

Using the igraph package to simplify a network graph.

An introductory guide to the Bioconductor project

An animation shows every commit to the R source code over 18 years.

General interest stories (not related to R) in the past month included: Macklemore on mopeds, reconstructed timelapses, a moving visualization of WW2 fatalities and the Magnus Effect.

As always, thanks for the comments and please send any suggestions to me at david@revolutionanalytics.com. Don't forget you can follow the blog using an RSS reader, via email using blogtrottr, or by following me on Twitter (I'm @revodavid). You can find roundups of previous months here.

To leave a comment for the author, please follow the link and comment on his blog: Revolutions.

R-bloggers.com offers daily e-mail updates about R news and tutorials on topics such as: visualization (ggplot2, Boxplots, maps, animation), programming (RStudio, Sweave, LaTeX, SQL, Eclipse, git, hadoop, Web Scraping) statistics (regression, PCA, time series, trading) and more...

New R Software/Methodology for Handling Missing Dat

$
0
0

(This article was first published on Mad (Data) Scientist, and kindly contributed to R-bloggers)

I’ve added some missing-data software to my regtools package on GitHub. In this post, I’ll give an overview of missing-data methodology, and explain what the software does. For details, see my JSM paper, jointly authored with my student Xiao (Max) Gu.

There is a long history of development of techniques for handling missing data. See the famous book by Little and Rubin (currently second edition, third due out in December). The main methods in use today fall into two classes:

  • Complete-cases (CC): (Also known at listwise deletion.) This approach is simple — just delete any record for which at least one of the variables has a missing (NA, in R) value.
  • Multiple imputation (MI): These methods involve estimating the conditional distribution of a missing variable from the others, and then sampling from that distribution via simulation. Multiple alternate versions of the data matrix are generated, with the NA values replaced by values that might have been the missing one.

In our work, we revisited, and broadened the scope of, another class of methods, which had been considered in the early years of missing-data research but pretty much abandoned for reasons to be explained shortly:

  • Available cases (AC): Also known as pairwise deletion.) If the statistical method involves computation involving, say, various pairs of variables, include in such a calculation any observation for which this pair is intact, regardless of whether the other variables are intact. The same holds for triples of variables and so on.

The early work on AC involved linear regression analysis. Say we are predicting a scalar Y from a vector X. The classic OLS estimator is (U’U)-1U’V, where U is the matrix of X values and V is the vector of Y values in our data. But if we center our data, that expression consists of the inverse of the sample covariance matrix of X, times the sample covariance of X and Y.

The key point is then that covariances only involve products of pairs of variables. As a simple example, say we are predicting human weight from height and age. Under AC, estimation of the covariance between weight and height can be done by using all records in the data for which the weight and height values are intact, even if age is missing. AC thus makes more thorough use of the data than does CC, and thus AC should be statistically more accurate than CC.

However, CC and AC make more stringent assumptions (concerning the mechanism underlying missingness) than does MI. Hence the popularity of MI. For R, for instance, the packages mi, mice and Amelia and others handle missing data in general,

We used Amelia as our representative MI method. Unfortunately, it is very long-running. In a PCA computation that we ran, for example, CC and AC took 0.0111 and 1.967 seconds, respectively, while MI had a run time of  92.928 seconds. And statistically, it was not performing any better than CC and AC, so we did not include it in our empirical investigations, though we did analyze it otherwise.

Our experiments involved taking real data sets, then randomly inserting NA values, thus generating many versions of the original data. One of the data sets, for instance, was from the 2008 census, consisting of all programmers and engineers in Silicon Valley. (There were about 20,000 in the PUMS sample. This data set is included in the regtools package.) The following table shows the variances of CC and AC estimates of the first regression coefficient (the means were almost identical, essentially no bias):

NA rate CC var. AC var.
0.01 0.4694873 0.1387395
0.05 2.998764 0.7655222
0.10 8.821311 1.530692

As you can see, AC had much better accuracy than CC on this real data set, and in fact was better than CC on the other 3 real data sets we tried as well.

But what about the famous MCAR assumption underlying CC and AC, which is stricter than the MAR assumption of MI methods? We argue in the paper (too involved to even summarize here) that this may be much less of an issue than has been supposed.

One contribution of our work is to extend AC to non-covariance settings, namely log-linear models.

Please try the software (in the functions lmac(), pcac() and loglinac() in the package), and let me know your thoughts.

To leave a comment for the author, please follow the link and comment on his blog: Mad (Data) Scientist.

R-bloggers.com offers daily e-mail updates about R news and tutorials on topics such as: visualization (ggplot2, Boxplots, maps, animation), programming (RStudio, Sweave, LaTeX, SQL, Eclipse, git, hadoop, Web Scraping) statistics (regression, PCA, time series, trading) and more...

Predicting Titanic deaths on Kaggle VI: Stan

$
0
0

(This article was first published on Wiekvoet, and kindly contributed to R-bloggers)

It is a bit a contradiction. Kaggle provides competitions on data science, while Stan is clearly part of the (Bayesian) statistics. Yet after using random forests, boosting and bagging, I also think this problem has a suitable size for Stan, which I understand can handle larger problems than older Bayesian software such as JAGS.

What I aim to do is enter a load of variables in the Stan model. Aliasing will be ignored, and I hope the hierarchical model will provide suitable shrinkage for terms which are not relevant. 

Data

The data has been mildly adapted from previously. Biggest change is that I have decided to make age into a factor, based on the value when present, with a special level for missing. The alternative in context of a Bayesian model would be to make fitting age part of the model, but that seems more complex than I am willing to go at this point.

Model

The idea of the model is pretty simple. it will be logistic regression, with only factors in the independent variables. All levels in all factors are used. So when Sex is entered in the model, it will add two parameter values, one for male, one for female (see code below, variable fsex). When passenger class is entered in the model, it has three values (variabe fpclass). Upon the parameter values there is a prior distribution. I have chosen a normal prior distribution, around zero with standard deviation sdsex and sdpclass respectively. These have a common prior (sd1). I have used both half normal with standard deviation 3 as below and uniform (0,3) for the prior.
  parameters {
    real fsex[2];
    real intercept;
    real fpclass[3];
    real <lower=0> sdsex;
    real <lower=0> sdpclass;
    real <lower=0> sd1;
  }
  transformed parameters {
    real expect[ntrain];
    for (i in 1:ntrain) {
      expect[i] <- inv_logit(
        intercept+
        fsex[sex[i]]+
        fpclass[pclass[i]]
        );
      }    
  }
  model {        
    fsex ~ normal(0,sdsex);
    fpclass ~ normal(0,sdpclass);

    sdsex ~  normal(0,sd1);
    sdpclass ~ normal(0,sd1);
    sd1 ~ normal(0,3);
    intercept ~ normal(0,1);
    survived ~ bernoulli(expect);
  }

Predictions

In this phase I have decided to make the predictions within the Stan program. The way which seemed to work is to duplicate all independent variables and do the predictions in the generated quantities section of the program. These predictions are actually probabilities of survival for each passenger for each MCMC sample. Hence a bit of post processing is used, the mean probability is calculated and a cut off of 0.5 is used to decide the final classification.
Since the Stan code runs pretty quickly after it has been compiled it is feasible to run this as a two stage process. A first run to examine the model parameters. A second run just to obtain the predictions.

Model 1

This is the parameter output of a model with just age and passenger class. It has been added here mostly to show a simple full coded example what the code looks like. With sdsex bigger than sdpclass it follows that sex had a bigger influence than class on the chance of survival.
Inference for Stan model: 8fb625a6ccf29aab919e1dcd494247aa.
4 chains, each with iter=1000; warmup=500; thin=1; 
post-warmup draws per chain=500, total post-warmup draws=2000.

              mean se_mean   sd    2.5%     25%     50%     75%   97.5% n_eff Rhat
intercept    -0.07    0.03 0.83   -1.68   -0.65   -0.07    0.49    1.61   670 1.00
fsex[1]       1.40    0.04 0.89   -0.46    0.83    1.40    1.98    3.07   533 1.01
fsex[2]      -1.24    0.04 0.89   -3.11   -1.81   -1.23   -0.65    0.45   529 1.01
fpclass[1]    0.94    0.03 0.70   -0.40    0.50    0.93    1.33    2.34   536 1.01
fpclass[2]    0.12    0.03 0.69   -1.24   -0.31    0.11    0.52    1.55   527 1.01
fpclass[3]   -0.93    0.03 0.69   -2.25   -1.35   -0.94   -0.50    0.47   499 1.01
sdsex         2.06    0.05 1.20    0.76    1.23    1.74    2.49    5.36   648 1.00
sdpclass      1.40    0.04 0.90    0.50    0.84    1.15    1.67    3.86   661 1.00
sd1           2.41    0.04 1.27    0.71    1.45    2.18    3.11    5.48  1071 1.00
lp__       -421.36    0.09 2.12 -426.25 -422.56 -421.00 -419.82 -418.19   616 1.00

Samples were drawn using NUTS(diag_e) at Sun Sep 13 12:28:49 2015.
For each parameter, n_eff is a crude measure of effective sample size,
and Rhat is the potential scale reduction factor on split chains (at 
convergence, Rhat=1).

Model 2

Model 2 has all linear effects in it. Predictions using this model were submitted, it gave a score of 0.78947 which was not an improvement over previous scores. I have one submission using bagging which did better, got same result with boosting and worse results with random forest. 

Note that while this model looks pretty complex, this score was obtained without any interactions. 
Inference for Stan model: 6278b3ebade9802ad9544b1242bada20.
4 chains, each with iter=1000; warmup=500; thin=1; 
post-warmup draws per chain=500, total post-warmup draws=2000.

                mean se_mean    sd    2.5%     25%     50%     75%   97.5% n_eff Rhat
intercept       0.28    0.05  0.74   -1.20   -0.16    0.28    0.77    1.68   229 1.01
sd1             0.80    0.03  0.23    0.43    0.63    0.77    0.97    1.31    63 1.05
fsex[1]         0.24    0.03  0.56   -0.64   -0.01    0.13    0.39    1.85   353 1.01
fsex[2]        -0.05    0.04  0.50   -1.29   -0.24    0.00    0.22    0.89   131 1.02
fpclass[1]      0.54    0.07  0.57   -0.39    0.15    0.53    0.90    1.77    60 1.03
fpclass[2]      0.15    0.06  0.50   -0.68   -0.27    0.16    0.50    1.15    76 1.01
fpclass[3]     -0.78    0.05  0.48   -1.66   -1.10   -0.79   -0.47    0.18   102 1.01
fembarked[1]    0.26    0.02  0.33   -0.29    0.06    0.22    0.43    1.02   298 1.01
fembarked[2]    0.08    0.02  0.32   -0.55   -0.07    0.06    0.20    0.78   456 1.00
fembarked[3]   -0.18    0.02  0.31   -0.80   -0.33   -0.18   -0.01    0.45   378 1.01
foe[1]         -0.32    0.08  0.53   -1.63   -0.65   -0.28    0.04    0.54    41 1.07
foe[2]          0.04    0.02  0.43   -0.73   -0.11    0.01    0.19    1.02   433 1.01
foe[3]          0.34    0.03  0.48   -0.41    0.04    0.26    0.57    1.54   227 1.03
fcabchar[1]    -0.25    0.18  0.46   -1.16   -0.49   -0.13    0.03    0.45     7 1.17
fcabchar[2]    -0.04    0.03  0.35   -0.86   -0.16   -0.04    0.10    0.62   143 1.03
fcabchar[3]     0.07    0.01  0.27   -0.47   -0.06    0.05    0.18    0.75   325 1.03
fcabchar[4]    -0.09    0.04  0.31   -0.85   -0.23   -0.03    0.08    0.48    55 1.05
fcabchar[5]     0.22    0.02  0.33   -0.32    0.00    0.17    0.40    1.03   219 1.02
fcabchar[6]     0.31    0.04  0.36   -0.25    0.02    0.25    0.59    1.12    76 1.03
fcabchar[7]    -0.21    0.06  0.40   -1.03   -0.43   -0.11    0.04    0.45    44 1.05
fage[1]         0.14    0.06  0.32   -0.38   -0.04    0.04    0.28    0.78    27 1.10
fage[2]         0.45    0.14  0.59   -0.12    0.02    0.17    0.77    1.68    19 1.17
fage[3]         0.10    0.15  0.53   -0.74   -0.15   -0.01    0.12    1.37    13 1.24
fage[4]        -0.10    0.01  0.31   -0.86   -0.25   -0.05    0.03    0.48   558 1.01
fage[5]         0.17    0.10  0.43   -0.52   -0.04    0.04    0.25    1.07    20 1.14
fage[6]         0.00    0.01  0.21   -0.42   -0.09   -0.01    0.09    0.47   250 1.01
fage[7]         0.09    0.03  0.20   -0.32   -0.01    0.05    0.22    0.47    50 1.05
fage[8]        -0.22    0.03  0.31   -1.06   -0.34   -0.15   -0.01    0.17   129 1.03
fage[9]        -0.02    0.07  0.39   -0.98   -0.16   -0.01    0.12    0.60    27 1.09
fage[10]        0.00    0.01  0.19   -0.43   -0.06    0.01    0.06    0.40   813 1.00
fticket[1]      0.07    0.03  0.21   -0.33   -0.06    0.04    0.22    0.51    54 1.05
fticket[2]     -0.04    0.03  0.34   -0.87   -0.17   -0.01    0.17    0.59   108 1.02
fticket[3]     -0.17    0.05  0.43   -1.23   -0.38   -0.09    0.06    0.60    69 1.04
fticket[4]      0.01    0.05  0.31   -0.48   -0.19    0.01    0.19    0.69    40 1.06
fticket[5]      0.02    0.02  0.36   -0.64   -0.13   -0.02    0.15    0.95   210 1.01
fticket[6]      0.03    0.05  0.32   -0.63   -0.15    0.02    0.21    0.55    37 1.07
fticket[7]      0.14    0.02  0.38   -0.40   -0.05    0.05    0.26    1.18   245 1.01
fticket[8]      0.01    0.01  0.35   -0.84   -0.12    0.02    0.20    0.73   929 1.01
fticket[9]      0.01    0.01  0.32   -0.69   -0.12    0.03    0.14    0.65   766 1.00
fticket[10]    -0.23    0.04  0.46   -1.53   -0.39   -0.08    0.03    0.38   149 1.02
fticket[11]    -0.02    0.01  0.32   -0.66   -0.16   -0.04    0.11    0.70  1001 1.01
fticket[12]     0.37    0.05  0.47   -0.16    0.03    0.20    0.57    1.58    82 1.04
fticket[13]    -0.20    0.02  0.34   -1.05   -0.36   -0.14    0.01    0.36   221 1.03
ftitle[1]       1.26    0.08  0.73   -0.03    0.75    1.20    1.74    2.85    79 1.03
ftitle[2]       0.47    0.04  0.70   -1.05    0.13    0.45    0.87    1.79   372 1.01
ftitle[3]      -2.27    0.03  0.66   -3.59   -2.59   -2.34   -1.88   -0.86   486 1.01
ftitle[4]       0.78    0.06  0.73   -0.86    0.35    0.89    1.25    2.10   144 1.01
fsibsp[1]       0.70    0.06  0.51   -0.33    0.36    0.69    1.09    1.69    77 1.04
fsibsp[2]       0.48    0.08  0.53   -0.62    0.14    0.49    0.93    1.46    49 1.06
fsibsp[3]       0.67    0.11  0.65   -0.60    0.23    0.61    1.16    1.85    35 1.07
fsibsp[4]      -1.58    0.04  0.64   -2.89   -2.03   -1.52   -1.16   -0.38   292 1.02
fparch[1]       0.25    0.02  0.33   -0.25    0.03    0.22    0.39    1.02   450 1.01
fparch[2]       0.04    0.01  0.33   -0.53   -0.13    0.00    0.17    0.83   521 1.01
fparch[3]      -0.03    0.06  0.38   -0.64   -0.22   -0.01    0.14    0.78    35 1.07
fparch[4]      -0.47    0.18  0.54   -1.48   -0.81   -0.31   -0.02    0.22     9 1.12
ffare[1]       -0.01    0.01  0.15   -0.39   -0.04    0.00    0.03    0.29   421 1.01
ffare[2]       -0.02    0.01  0.15   -0.41   -0.06    0.00    0.02    0.26   419 1.01
ffare[3]       -0.02    0.01  0.15   -0.35   -0.06    0.00    0.02    0.26   671 1.00
ffare[4]        0.00    0.01  0.16   -0.31   -0.05    0.00    0.04    0.36   586 1.01
ffare[5]        0.08    0.01  0.20   -0.15   -0.01    0.01    0.12    0.66   247 1.02
sdsex           0.51    0.04  0.44    0.03    0.21    0.35    0.68    1.64   123 1.01
sdpclass        0.75    0.04  0.36    0.32    0.48    0.68    0.94    1.59    64 1.04
sdembarked      0.43    0.02  0.32    0.06    0.21    0.39    0.53    1.24   328 1.01
sdoe            0.56    0.05  0.38    0.06    0.32    0.47    0.73    1.51    48 1.05
sdcabchar       0.39    0.03  0.26    0.03    0.18    0.36    0.59    0.97    61 1.04
sdage           0.33    0.06  0.29    0.02    0.09    0.23    0.53    0.89    23 1.15
sdticket        0.35    0.03  0.24    0.04    0.19    0.30    0.45    0.99    68 1.05
sdtitle         1.29    0.02  0.35    0.75    1.07    1.19    1.47    2.15   320 1.01
sdsibsp         1.00    0.02  0.37    0.49    0.74    0.95    1.16    1.95   222 1.01
sdparch         0.47    0.12  0.37    0.01    0.16    0.38    0.73    1.25    10 1.12
sdfare          0.14    0.02  0.17    0.00    0.02    0.09    0.19    0.60    92 1.03
lp__         -342.28    2.74 15.87 -372.33 -353.23 -344.26 -330.95 -310.12    34 1.09

Samples were drawn using NUTS(diag_e) at Sun Aug 30 13:00:19 2015.
For each parameter, n_eff is a crude measure of effective sample size,
and Rhat is the potential scale reduction factor on split chains (at 
convergence, Rhat=1).

Code

Data reading

# preparation and data reading section
library(rstan)
rstan_options(auto_write = TRUE)
options(mc.cores = parallel::detectCores())

# read and combine
train <- read.csv(‘train.csv’)
train$status <- ‘train’
test  <- read.csv(‘test.csv’)
test$status <- ‘test’
test$Survived <- NA
tt <- rbind(test,train)

# generate variables
tt$Embarked[tt$Embarked==”] <- ‘S’
tt$Embarked <- factor(tt$Embarked)
tt$Pclass <- factor(tt$Pclass)
tt$Survived <- factor(tt$Survived)
tt$age <- tt$Age
tt$age[is.na(tt$age)] <- 999
tt$age <- cut(tt$age,c(0,2,5,9,12,15,21,55,65,100,1000))

tt$Title <- sapply(tt$Name,function(x) strsplit(as.character(x),'[.,]’)[[1]][2])
tt$Title <- gsub(‘ ‘,”,tt$Title)
tt$Title[tt$Title==’Dr’ & tt$Sex==’female’] <- ‘Miss’
tt$Title[tt$Title %in% c(‘Capt’,’Col’,’Don’,’Sir’,’Jonkheer’,’Major’,’Rev’,’Dr’)] <- ‘Mr’
tt$Title[tt$Title %in% c(‘Lady’,’Ms’,’theCountess’,’Mlle’,’Mme’,’Ms’,’Dona’)] <- ‘Miss’
tt$Title <- factor(tt$Title)
# changed cabin character
tt$cabchar <- substr(tt$Cabin,1,1)
tt$cabchar[tt$cabchar %in% c(‘F’,’G’,’T’)] <- ‘X';
tt$cabchar <- factor(tt$cabchar)
tt$ncabin <- nchar(as.character(tt$Cabin))
tt$cn <- as.numeric(gsub(‘[[:space:][:alpha:]]’,”,tt$Cabin))
tt$oe <- factor(ifelse(!is.na(tt$cn),tt$cn%%2,-1))
tt$Fare[is.na(tt$Fare)]<- median(tt$Fare,na.rm=TRUE)
tt$ticket <- sub(‘[[:digit:]]+$’,”,tt$Ticket)
tt$ticket <- toupper(gsub(‘(\.)|( )|(/)’,”,tt$ticket))
tt$ticket[tt$ticket %in% c(‘A2′,’A4′,’AQ3′,’AQ4′,’AS’)] <- ‘An’
tt$ticket[tt$ticket %in% c(‘SCA3′,’SCA4′,’SCAH’,’SC’,’SCAHBASLE’,’SCOW’)] <- ‘SC’
tt$ticket[tt$ticket %in% c(‘CASOTON’,’SOTONO2′,’SOTONOQ’)] <- ‘SOTON’
tt$ticket[tt$ticket %in% c(‘STONO2′,’STONOQ’)] <- ‘STON’
tt$ticket[tt$ticket %in% c(‘C’)] <- ‘CA’
tt$ticket[tt$ticket %in% c(‘SOC’,’SOP’,’SOPP’)] <- ‘SOP’
tt$ticket[tt$ticket %in% c(‘SWPP’,’WC’,’WEP’)] <- ‘W’
tt$ticket[tt$ticket %in% c(‘FA’,’FC’,’FCC’)] <- ‘F’
tt$ticket[tt$ticket %in% c(‘PP’,’PPP’,’LINE’,’LP’,’SP’)] <- ‘PPPP’
tt$ticket <- factor(tt$ticket)
tt$fare <- cut(tt$Fare,breaks=c(min(tt$Fare)-1,quantile(tt$Fare,seq(.2,.8,.2)),max(tt$Fare)+1))

train <- tt[tt$status==’train’,]
test <- tt[tt$status==’test’,]

#end of preparation and data reading

options(width=90)

First model

datain <- list(
    survived = c(0,1)[train$Survived],

    ntrain = nrow(train),

    ntest=nrow(test),
    sex=c(1:2)[train$Sex],
    psex=c(1:2)[test$Sex],
    pclass=c(1:3)[train$Pclass],
    ppclass=c(1:3)[test$Pclass]    
)

parameters=c(‘intercept’,’fsex’,’fpclass’,’sdsex’,’sdpclass’,’sd1′)
my_code <- ‘ 
    data {
    int<lower=0> ntrain;
    int<lower=0> ntest;
    int survived[ntrain];
    int <lower=1,upper=2> sex[ntrain];
    int <lower=1,upper=2> psex[ntest];
    int <lower=1,upper=3> pclass[ntrain];
    int <lower=1,upper=3> ppclass[ntest];

    }
    parameters {
    real fsex[2];
    real intercept;
    real fpclass[3];
    real <lower=0> sdsex;
    real <lower=0> sdpclass;
    real <lower=0> sd1;
    }
    transformed parameters {
    real expect[ntrain];
    for (i in 1:ntrain) {
    expect[i] <- inv_logit(
      intercept+
      fsex[sex[i]]+
      fpclass[pclass[i]]
    );
    }
    
    }
    model {        
    fsex ~ normal(0,sdsex);
    fpclass ~ normal(0,sdpclass);

    sdsex ~  normal(0,sd1);
    sdpclass ~ normal(0,sd1);
    sd1 ~ normal(0,3);
    intercept ~ normal(0,1);
    survived ~ bernoulli(expect);
    }
    generated quantities {
    real pred[ntest];
    for (i in 1:ntest) {
    pred[i] <- inv_logit(
    intercept+
        fsex[psex[i]]+
        fpclass[ppclass[i]]

    );
    }
    }
    ‘

fit1 <- stan(model_code = my_code, 
    data = datain, 
    pars=parameters,
    iter = 1000, 
    chains = 4,
    open_progress=FALSE)

fit1

Second model

datain <- list(
    survived = c(0,1)[train$Survived],
    ntrain = nrow(train),
    ntest=nrow(test),
    sex=c(1:2)[train$Sex],
    psex=c(1:2)[test$Sex],
    pclass=c(1:3)[train$Pclass],
    ppclass=c(1:3)[test$Pclass],
    embarked=c(1:3)[train$Embarked],
    pembarked=c(1:3)[test$Embarked],
    oe=c(1:3)[train$oe],
    poe=c(1:3)[test$oe],
    cabchar=c(1:7)[train$cabchar],
    pcabchar=c(1:7)[test$cabchar],
    age=c(1:10)[train$age],
    page=c(1:10)[test$age],
    ticket=c(1:13)[train$ticket],
    pticket=c(1:13)[test$ticket],
    title=c(1:4)[train$Title],
    ptitle=c(1:4)[test$Title],
    sibsp=c(1:4,rep(4,6))[train$SibSp+1],
    psibsp=c(1:4,rep(4,6))[test$SibSp+1],
    parch=c(1:4,rep(4,6))[train$Parch+1],
    pparch=c(1:4,rep(4,6))[test$Parch+1],
    fare=c(1:5)[train$fare],
    pfare=c(1:5)[test$fare]
)

parameters=c(‘intercept’,’sd1′,
    ‘fsex’,’fpclass’,’fembarked’,
    ‘foe’,’fcabchar’,’fage’,
    ‘fticket’,’ftitle’,
    ‘fsibsp’,’fparch’,
    ‘ffare’,
    ‘sdsex’,’sdpclass’,’sdembarked’,
    ‘sdoe’,’sdcabchar’,’sdage’,
    ‘sdticket’,’sdtitle’,
    ‘sdsibsp’,’sdparch’,
    ‘sdfare’)
my_code <- ‘ 
    data {
    int<lower=0> ntrain;
    int<lower=0> ntest;
    int survived[ntrain];
    int <lower=1,upper=2> sex[ntrain];
    int <lower=1,upper=2> psex[ntest];
    int <lower=1,upper=3> pclass[ntrain];
    int <lower=1,upper=3> ppclass[ntest];
    int <lower=1,upper=3> embarked[ntrain];
    int <lower=1,upper=3> pembarked[ntest];
    int <lower=1,upper=3> oe[ntrain];
    int <lower=1,upper=3> poe[ntest];
    int <lower=1,upper=7> cabchar[ntrain];
    int <lower=1,upper=7> pcabchar[ntest];
    int <lower=1,upper=10> age[ntrain];
    int <lower=1,upper=10> page[ntest];
    int <lower=1,upper=13> ticket[ntrain];
    int <lower=1,upper=13> pticket[ntest];
    int <lower=1,upper=4> title[ntrain];
    int <lower=1,upper=4> ptitle[ntest];
    int <lower=1,upper=4> sibsp[ntrain];
    int <lower=1,upper=4> psibsp[ntest];
    int <lower=1,upper=4> parch[ntrain];
    int <lower=1,upper=4> pparch[ntest];
    int <lower=1,upper=5> fare[ntrain];
    int <lower=1,upper=5> pfare[ntest];
    
    }
    parameters {
    real fsex[2];
    real intercept;
    real fpclass[3];
    real fembarked[3];
    real foe[3];
    real fcabchar[7];
    real fage[10];
    real fticket[13];
    real ftitle[4];
    real fparch[4];
    real fsibsp[4];
    real ffare[5];
    real <lower=0> sdsex;
    real <lower=0> sdpclass;
    real <lower=0> sdembarked;
    real <lower=0> sdoe;
    real <lower=0> sdcabchar;
    real <lower=0> sdage;
    real <lower=0> sdticket;
    real <lower=0> sdtitle;
    real <lower=0> sdparch;
    real <lower=0> sdsibsp;
    real <lower=0> sdfare;

    real <lower=0> sd1;
    }
    transformed parameters {
    real expect[ntrain];
    for (i in 1:ntrain) {
    expect[i] <- inv_logit(
    intercept+
    fsex[sex[i]]+
    fpclass[pclass[i]]+
    fembarked[embarked[i]]+
    foe[oe[i]]+
    fcabchar[cabchar[i]]+
    fage[age[i]]+
    fticket[ticket[i]]+
    ftitle[title[i]]+
    fsibsp[sibsp[i]]+
    fparch[parch[i]]+
    ffare[fare[i]]
    );
    }
    
    }
    model {        
    fsex ~ normal(0,sdsex);
    fpclass ~ normal(0,sdpclass);
    fembarked ~ normal(0,sdembarked);
    foe ~ normal(0,sdoe);
    fcabchar ~ normal(0,sdcabchar);
    fage ~ normal(0,sdage);
    fticket ~ normal(0,sdticket);
    ftitle ~ normal(0,sdtitle);
    fsibsp ~ normal(0,sdsibsp);
    fparch ~ normal(0,sdparch);
    ffare ~ normal(0,sdfare);

    sdsex ~  normal(0,sd1);
    sdpclass ~ normal(0,sd1);
    sdembarked ~ normal(0,sd1);
    sdoe ~ normal(0,sd1);
    sdcabchar ~ normal(0,sd1);
    sdage ~ normal(0,sd1);
    sdticket ~ normal(0,sd1);
    sdtitle ~ normal(0,sd1);
    sdsibsp ~ normal(0,sd1);
    sdparch ~ normal(0,sd1);
    sdfare ~ normal(0,sd1);
    sd1 ~ normal(0,1);
    intercept ~ normal(0,1);

    survived ~ bernoulli(expect);
    }
    generated quantities {
    real pred[ntest];
    for (i in 1:ntest) {
    pred[i] <- inv_logit(
    intercept+
    fsex[psex[i]]+
    fpclass[ppclass[i]]+
    fembarked[pembarked[i]]+
    foe[poe[i]]+
    fcabchar[pcabchar[i]]+
    fage[page[i]]+
    fticket[pticket[i]]+
    ftitle[ptitle[i]]+
    fsibsp[psibsp[i]]+
    fparch[pparch[i]]+
    ffare[pfare[i]]

    );
    }
    }
    ‘

fit1 <- stan(model_code = my_code, 
    data = datain, 
    pars=parameters,
    iter = 1000, 
    chains = 4,
    open_progress=FALSE)

fit1
#plot(fit1,ask=TRUE)
#traceplot(fit1,ask=TRUE)
fit2 <- stan(model_code = my_code, 
    data = datain, 
    fit=fit1,
    pars=c(‘pred’),
    iter = 2000, 
    warmup =200,
    chains = 4,
    open_progress=FALSE)

fit3 <- as.matrix(fit2)[,-419]
#plots of individual passengers
#plot(density(fit3[,1]))

#plot(density(fit3[,18]))
#plot(density(as.numeric(fit3),adjust=.3))
decide1 <- apply(fit3,2,function(x) mean(x)>.5)
decide2 <- apply(fit3,2,function(x) median(x)>.5)
#table(decide1,decide2)

out <- data.frame(
    PassengerId=test$PassengerId,
    Survived=as.numeric(decide1),
    row.names=NULL)
write.csv(x=out,
    file=’stanlin.csv’,
    row.names=FALSE,
    quote=FALSE)

To leave a comment for the author, please follow the link and comment on their blog: Wiekvoet.

R-bloggers.com offers daily e-mail updates about R news and tutorials on topics such as: visualization (ggplot2, Boxplots, maps, animation), programming (RStudio, Sweave, LaTeX, SQL, Eclipse, git, hadoop, Web Scraping) statistics (regression, PCA, time series, trading) and more...

Six lines to install and start SparkR on Mac OS X Yosemite

$
0
0

(This article was first published on Opiate for the masses, and kindly contributed to R-bloggers)

I know there are many R users who like to test out SparkR without all the configuration hassle. Just these six lines and you can start SparkR from both RStudio and command line.

luigi-workflow

One line for Spark and SparkR

Apache Spark is a fast and general-purpose cluster computing system

SparkR is an R package that provides a light-weight frontend to use Apache Spark from R

Six lines to start SparkR

The first three lines should be called in your command line.

brew update # If you don't have homebrew, get it from here (http://brew.sh/)
brew install hadoop # Install Hadoop
brew install apache-spark # Install Spark

You can already start SparkR shell by typing this in your command line;

SparkR

If you like to call it from RStudio, execute the rest in R

spark_path <- strsplit(system("brew info apache-spark",intern=T)[4],' ')[[1]][1] # Get your spark path
.libPaths(c(file.path(spark_path,"libexec", "R", "lib"), .libPaths())) # Navigate to SparkR folder
library(SparkR) # Load the library

That’s all.
Now this should run in your RStudio

sc <- sparkR.init()
sqlContext <- sparkRSQL.init(sc)
df <- createDataFrame(sqlContext, iris) 
head(df)
# Sepal_Length Sepal_Width Petal_Length Petal_Width Species
# 1          5.1         3.5          1.4         0.2  setosa
# 2          4.9         3.0          1.4         0.2  setosa
# 3          4.7         3.2          1.3         0.2  setosa
# 4          4.6         3.1          1.5         0.2  setosa
# 5          5.0         3.6          1.4         0.2  setosa
# 6          5.4         3.9          1.7         0.4  setosa

Enjoy!

Codes

The full codes are available from here.

Six lines to install and start SparkR on Mac OS X Yosemite was originally published by Kirill Pomogajko at Opiate for the masses on September 21, 2015.

To leave a comment for the author, please follow the link and comment on their blog: Opiate for the masses.

R-bloggers.com offers daily e-mail updates about R news and tutorials on topics such as: visualization (ggplot2, Boxplots, maps, animation), programming (RStudio, Sweave, LaTeX, SQL, Eclipse, git, hadoop, Web Scraping) statistics (regression, PCA, time series, trading) and more...
Viewing all 209 articles
Browse latest View live


Latest Images